

μ ¼ μ max  Min
C Glucose
K Glucose þ C Glucose
,
C O 2
K O 2 þ C O 2
ð3Þ
Glucose feed and gas flow rates are 0.11 mol/s and 0.21 kg/s, respectively. These
values are handpicked to put emphasis on the underlying gradients affecting the
specific regimes. Here, we characterize the microbial kinetics for a hypothetical
E. coli strain with respect to available glucose and oxygen concentrations and assign
regimes (Fig. 4).
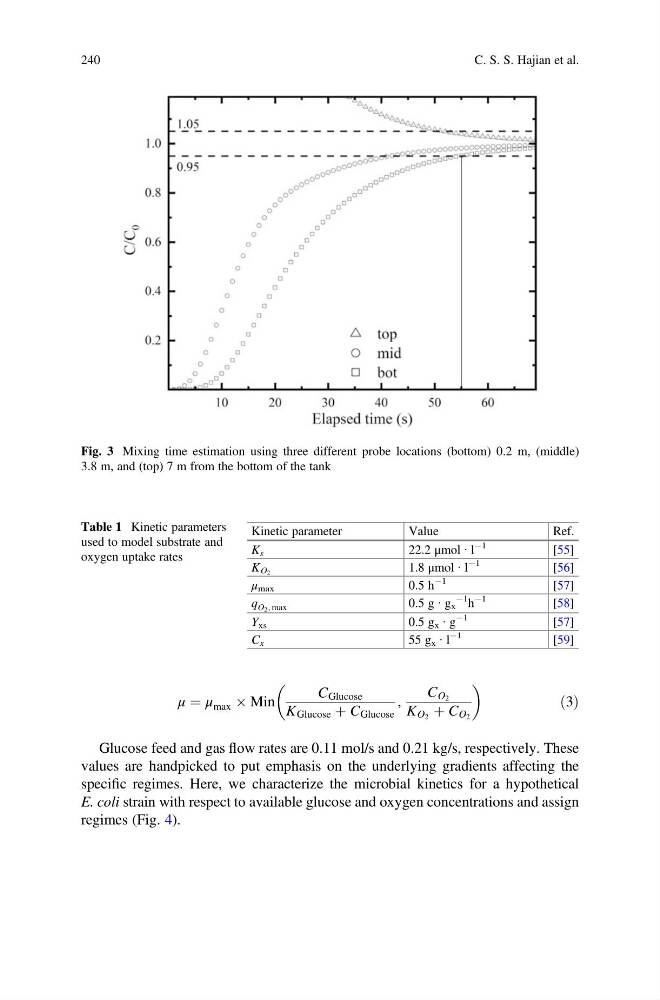
Fig. 3 Mixing time estimation using three different probe locations (bottom) 0.2 m, (middle)
3.8 m, and (top) 7 m from the bottom of the tank
Table 1 Kinetic parameters
used to model substrate and
oxygen uptake rates
Kinetic parameter
Value
Ref.
K s
22.2 μmol ∙ l
À1
[55]
K O2
1.8 μmol ∙ l
À1
[56]
μ max
0.5 h
À1
[57]
q O2, max
0.5 g ∙ g x
À1
h
À1
[58]
Y xs
0.5 g x ∙ g
À1
[57]
C x
55 g x ∙ l
À1
[59]
240
C. S. S. Hajian et al.
C Glucose
K Glucose þ C Glucose
,
C O 2
K O 2 þ C O 2
ð3Þ
Glucose feed and gas flow rates are 0.11 mol/s and 0.21 kg/s, respectively. These
values are handpicked to put emphasis on the underlying gradients affecting the
specific regimes. Here, we characterize the microbial kinetics for a hypothetical
E. coli strain with respect to available glucose and oxygen concentrations and assign
regimes (Fig. 4).
Fig. 3 Mixing time estimation using three different probe locations (bottom) 0.2 m, (middle)
3.8 m, and (top) 7 m from the bottom of the tank
Table 1 Kinetic parameters
used to model substrate and
oxygen uptake rates
Kinetic parameter
Value
Ref.
K s
22.2 μmol ∙ l
À1
[55]
K O2
1.8 μmol ∙ l
À1
[56]
μ max
0.5 h
À1
[57]
q O2, max
0.5 g ∙ g x
À1
h
À1
[58]
Y xs
0.5 g x ∙ g
À1
[57]
C x
55 g x ∙ l
À1
[59]
240
C. S. S. Hajian et al.