

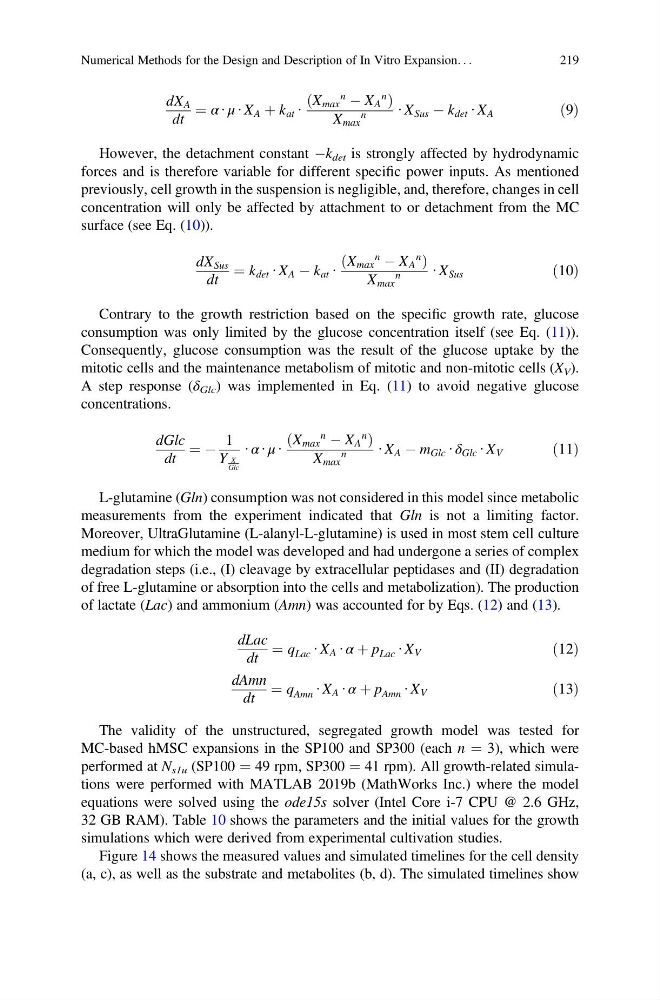
dX A
dt
¼ α ∙ μ ∙ X A þ k at ∙
X max
n
À X A
n
ð
Þ
X max
n
∙ X Sus À k det ∙ X A
ð9Þ
However, the detachment constant Àk det is strongly affected by hydrodynamic
forces and is therefore variable for different specific power inputs. As mentioned
previously, cell growth in the suspension is negligible, and, therefore, changes in cell
concentration will only be affected by attachment to or detachment from the MC
surface (see Eq. (10)).
dX Sus
dt
¼ k det ∙ X A À k at ∙
X max
n
À X A
n
ð
Þ
X max
n
∙ X Sus
ð10Þ
Contrary to the growth restriction based on the specific growth rate, glucose
consumption was only limited by the glucose concentration itself (see Eq. (11)).
Consequently, glucose consumption was the result of the glucose uptake by the
mitotic cells and the maintenance metabolism of mitotic and non-mitotic cells (X V ).
A step response (δ Glc ) was implemented in Eq. (11) to avoid negative glucose
concentrations.
dGlc
dt
¼ À
1
Y X
Glc
∙ α ∙ μ ∙
X max
n
À X A
n
ð
Þ
X max
n
∙ X A À m Glc ∙ δ Glc ∙ X V
ð11Þ
L-glutamine (Gln) consumption was not considered in this model since metabolic
measurements from the experiment indicated that Gln is not a limiting factor.
Moreover, UltraGlutamine (L-alanyl-L-glutamine) is used in most stem cell culture
medium for which the model was developed and had undergone a series of complex
degradation steps (i.e., (I) cleavage by extracellular peptidases and (II) degradation
of free L-glutamine or absorption into the cells and metabolization). The production
of lactate (Lac) and ammonium (Amn) was accounted for by Eqs. (12) and (13).
dLac
dt
¼ q Lac ∙ X A ∙ α þ p Lac ∙ X V
ð12Þ
dAmn
dt
¼ q Amn ∙ X A ∙ α þ p Amn ∙ X V
ð13Þ
The validity of the unstructured, segregated growth model was tested for
MC-based hMSC expansions in the SP100 and SP300 (each n ¼ 3), which were
performed at N s1u (SP100 ¼ 49 rpm, SP300 ¼ 41 rpm). All growth-related simulations were performed with MATLAB 2019b (MathWorks Inc.) where the model
equations were solved using the ode15s solver (Intel Core i-7 CPU @ 2.6 GHz,
32 GB RAM). Table 10 shows the parameters and the initial values for the growth
simulations which were derived from experimental cultivation studies.
Figure 14 shows the measured values and simulated timelines for the cell density
(a, c), as well as the substrate and metabolites (b, d). The simulated timelines show
Numerical Methods for the Design and Description of In Vitro Expansion. . .
219
dt
¼ α ∙ μ ∙ X A þ k at ∙
X max
n
À X A
n
ð
Þ
X max
n
∙ X Sus À k det ∙ X A
ð9Þ
However, the detachment constant Àk det is strongly affected by hydrodynamic
forces and is therefore variable for different specific power inputs. As mentioned
previously, cell growth in the suspension is negligible, and, therefore, changes in cell
concentration will only be affected by attachment to or detachment from the MC
surface (see Eq. (10)).
dX Sus
dt
¼ k det ∙ X A À k at ∙
X max
n
À X A
n
ð
Þ
X max
n
∙ X Sus
ð10Þ
Contrary to the growth restriction based on the specific growth rate, glucose
consumption was only limited by the glucose concentration itself (see Eq. (11)).
Consequently, glucose consumption was the result of the glucose uptake by the
mitotic cells and the maintenance metabolism of mitotic and non-mitotic cells (X V ).
A step response (δ Glc ) was implemented in Eq. (11) to avoid negative glucose
concentrations.
dGlc
dt
¼ À
1
Y X
Glc
∙ α ∙ μ ∙
X max
n
À X A
n
ð
Þ
X max
n
∙ X A À m Glc ∙ δ Glc ∙ X V
ð11Þ
L-glutamine (Gln) consumption was not considered in this model since metabolic
measurements from the experiment indicated that Gln is not a limiting factor.
Moreover, UltraGlutamine (L-alanyl-L-glutamine) is used in most stem cell culture
medium for which the model was developed and had undergone a series of complex
degradation steps (i.e., (I) cleavage by extracellular peptidases and (II) degradation
of free L-glutamine or absorption into the cells and metabolization). The production
of lactate (Lac) and ammonium (Amn) was accounted for by Eqs. (12) and (13).
dLac
dt
¼ q Lac ∙ X A ∙ α þ p Lac ∙ X V
ð12Þ
dAmn
dt
¼ q Amn ∙ X A ∙ α þ p Amn ∙ X V
ð13Þ
The validity of the unstructured, segregated growth model was tested for
MC-based hMSC expansions in the SP100 and SP300 (each n ¼ 3), which were
performed at N s1u (SP100 ¼ 49 rpm, SP300 ¼ 41 rpm). All growth-related simulations were performed with MATLAB 2019b (MathWorks Inc.) where the model
equations were solved using the ode15s solver (Intel Core i-7 CPU @ 2.6 GHz,
32 GB RAM). Table 10 shows the parameters and the initial values for the growth
simulations which were derived from experimental cultivation studies.
Figure 14 shows the measured values and simulated timelines for the cell density
(a, c), as well as the substrate and metabolites (b, d). The simulated timelines show
Numerical Methods for the Design and Description of In Vitro Expansion. . .
219