

considered before the cells began to proliferate. The cell adaption phase was
considered by introducing the coefficient α (see Eq. (7)),
α t
ð Þ ¼
t
n
t l
n þ t n
ð7Þ
where t l defined the lag time or adaption time and the point at which α(t) is half of the
maximum. The exponent n affects the slope of f(α(t)). If n ¼ 1, α(t) is described by
Michaelis-Menten kinetics. Otherwise, a sigmoidal curve is obtained that becomes
steeper as n increases. Both variables can be obtained from experimental growth
studies.
The specific cell growth rate (μ) was calculated based on Monod-type kinetics.
Hence, glucose (Glc), lactate (Lac), ammonium (Amn), and the available growth
surface (X max ) were considered to be influencing factors (see Eq. (8)). However,
investigations indicated that cell growth restriction based on maximum available
growth surface does not follow a normal Monod-type kinetic. This fact can mainly
be ascribed to cell migration during cell growth. Thus, the effect of the growth
surface restriction term becomes more significant towards the end of the cell growth
phase. For this reason, the exponent n was also introduced in Eq. (8).
μ ¼ μ max ∙
Glc
K Glc þ Glc
∙
K Lac
K Lac þ Lac
∙
K Amn
K Amn þ Amn
∙
X max
n
À X A
n
X max
n
ð8Þ
The cell number on the MC surface (X A ) increased through mitotic cell division
and the attachment of cells from the suspension (see Eq. (9)). However, this increase
in cell number was affected by the detachment of hMSCs from the planar growth
surface, which was accounted for by the detachment constant (-k det ).
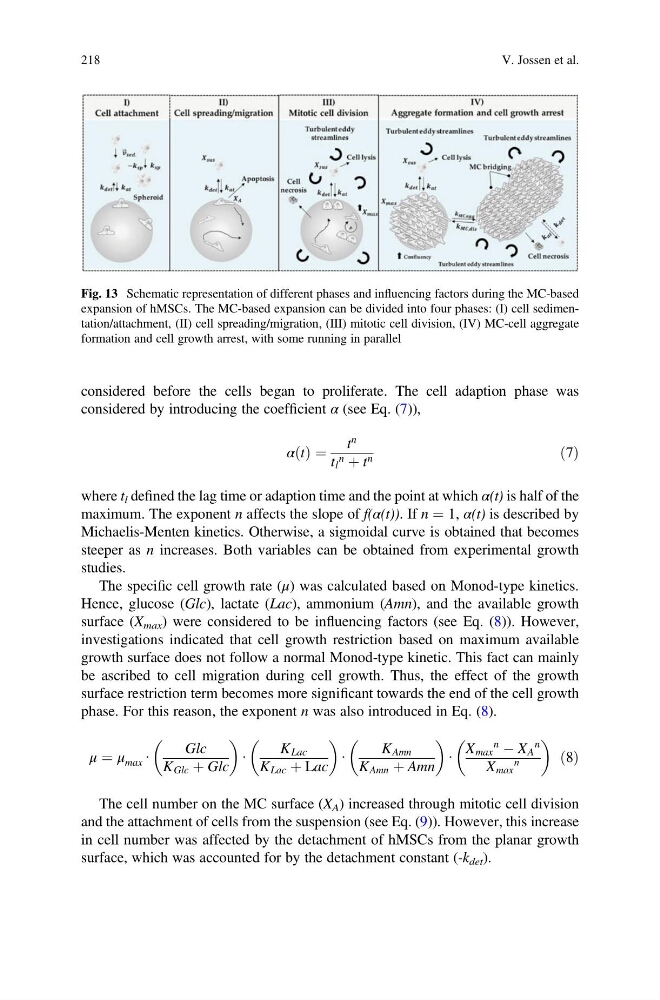
Fig. 13 Schematic representation of different phases and influencing factors during the MC-based
expansion of hMSCs. The MC-based expansion can be divided into four phases: (I) cell sedimentation/attachment, (II) cell spreading/migration, (III) mitotic cell division, (IV) MC-cell aggregate
formation and cell growth arrest, with some running in parallel
218
V. Jossen et al.
considered by introducing the coefficient α (see Eq. (7)),
α t
ð Þ ¼
t
n
t l
n þ t n
ð7Þ
where t l defined the lag time or adaption time and the point at which α(t) is half of the
maximum. The exponent n affects the slope of f(α(t)). If n ¼ 1, α(t) is described by
Michaelis-Menten kinetics. Otherwise, a sigmoidal curve is obtained that becomes
steeper as n increases. Both variables can be obtained from experimental growth
studies.
The specific cell growth rate (μ) was calculated based on Monod-type kinetics.
Hence, glucose (Glc), lactate (Lac), ammonium (Amn), and the available growth
surface (X max ) were considered to be influencing factors (see Eq. (8)). However,
investigations indicated that cell growth restriction based on maximum available
growth surface does not follow a normal Monod-type kinetic. This fact can mainly
be ascribed to cell migration during cell growth. Thus, the effect of the growth
surface restriction term becomes more significant towards the end of the cell growth
phase. For this reason, the exponent n was also introduced in Eq. (8).
μ ¼ μ max ∙
Glc
K Glc þ Glc
∙
K Lac
K Lac þ Lac
∙
K Amn
K Amn þ Amn
∙
X max
n
À X A
n
X max
n
ð8Þ
The cell number on the MC surface (X A ) increased through mitotic cell division
and the attachment of cells from the suspension (see Eq. (9)). However, this increase
in cell number was affected by the detachment of hMSCs from the planar growth
surface, which was accounted for by the detachment constant (-k det ).
Fig. 13 Schematic representation of different phases and influencing factors during the MC-based
expansion of hMSCs. The MC-based expansion can be divided into four phases: (I) cell sedimentation/attachment, (II) cell spreading/migration, (III) mitotic cell division, (IV) MC-cell aggregate
formation and cell growth arrest, with some running in parallel
218
V. Jossen et al.