

Table 10 Cell growth-dependent parameters used for the simulations of the MC-based hMSC cell
growth in the SP100 and SP300
Parameter
Values
Parameter
Values
μ max
1/d
0.64–0.68
Lac
mmol/L
0.0
Amn
mmol/L
0.0
q Amn
mmol/cell/d
6–19
Glc
mmol/L
30.5
q Glc
mmol/cell/d
9.8–35
k at
1/d
0.4–1.0
q Lac
mmol/cell/d
20–89
k det
1/d
0.003–0.009
t l
d
1.5–1.9
K Amn
mmol/L
8–10
X A
cells/mL
0
K Glc
mmol/L
0.4
X Sus
cells/mL
10,800
K Lav
mmol/L
35–50
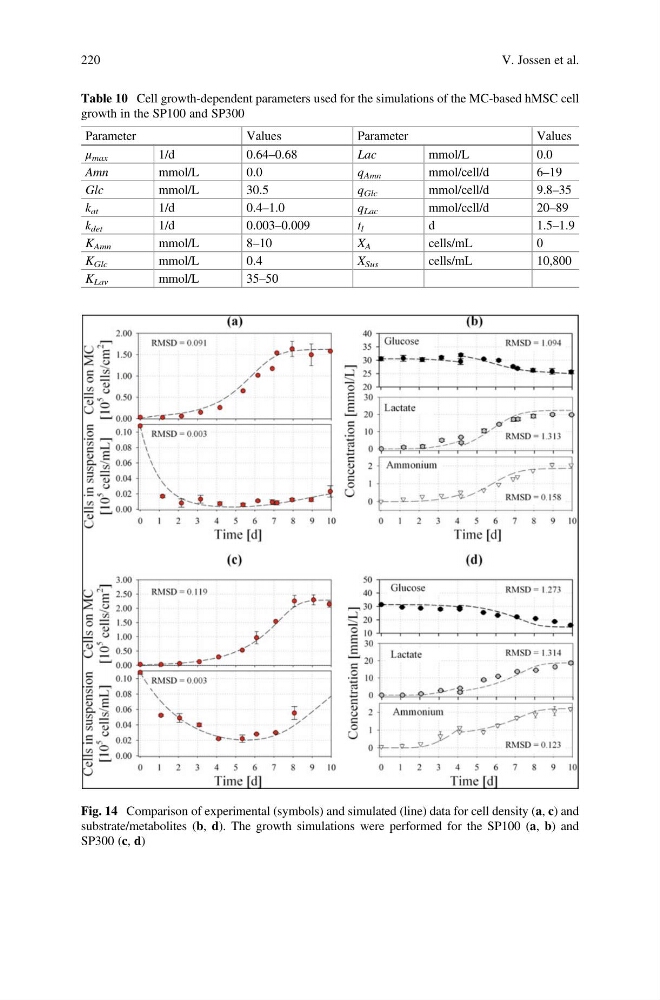
Fig. 14 Comparison of experimental (symbols) and simulated (line) data for cell density (a, c) and
substrate/metabolites (b, d). The growth simulations were performed for the SP100 (a, b) and
SP300 (c, d)
220
V. Jossen et al.
growth in the SP100 and SP300
Parameter
Values
Parameter
Values
μ max
1/d
0.64–0.68
Lac
mmol/L
0.0
Amn
mmol/L
0.0
q Amn
mmol/cell/d
6–19
Glc
mmol/L
30.5
q Glc
mmol/cell/d
9.8–35
k at
1/d
0.4–1.0
q Lac
mmol/cell/d
20–89
k det
1/d
0.003–0.009
t l
d
1.5–1.9
K Amn
mmol/L
8–10
X A
cells/mL
0
K Glc
mmol/L
0.4
X Sus
cells/mL
10,800
K Lav
mmol/L
35–50
Fig. 14 Comparison of experimental (symbols) and simulated (line) data for cell density (a, c) and
substrate/metabolites (b, d). The growth simulations were performed for the SP100 (a, b) and
SP300 (c, d)
220
V. Jossen et al.