

were obtained where highest forces occurred in the lowest segment. Thus, cells on
MCs were more stressed in the lowest spinner segment. This observation was also
supported by the fact that the highest probability of the presence of MCs was in the
lowest spinner segment. However, the effects of the hydrodynamic stresses in the
different zones depended heavily on the particle circulation and residence times,
demonstrating the dynamics and complexity of the systems. For this reason, circulation times and residence times were calculated for each individual spinner segment
based on the particle tracking data and were subsequently averaged over the four
segments (see Table 7). As expected, the circulation times (2.7–11.5 s) decreased
proportionally to the residence times (0.74–4.94 s) as the impeller speed was
increased. Interestingly, the proportionality constants for the SP100 (¼ 0.54) and
the SP300 (¼0.49) were quite similar. This observation can be ascribed to the
comparable fluid flow conditions. The calculated mean forces were inversely proportional to the circulation and residence times. This finding is not unexpected since
the specific power input, which can be calculated based on the torque acting on the
impeller during the CFD simulation, increased by approximately the 3rd power in
both spinner flask types. Interestingly, the mean values of particle forces did not
change significantly between the lower impeller speeds (N < N s1u ) and the two
suspension criteria, even though the circulation and residence times decreased by up
to 50%. Impeller speeds exceeding N s1u and N s1 resulted in a slight decrease of the
circulation times, although the related particle forces increased by exponents of
0.07–0.12 in respect of the resulting specific power input.
Comparable observations for the specific power input are also possible when
considering the local normal and shear stresses, which can be calculated according to
Wollny [91]. The volume-weighted mean values of the local normal and shear
stresses were in a comparable range in both spinner flask types for impeller speeds
between N s1u and N s1 . Consequently, comparable conditions in terms of hydrodynamic stresses can be expected for cultivations in the resulting specific power input
range of 0.3–1.1 W/m
3 . Another popular method for evaluating hydrodynamic stress
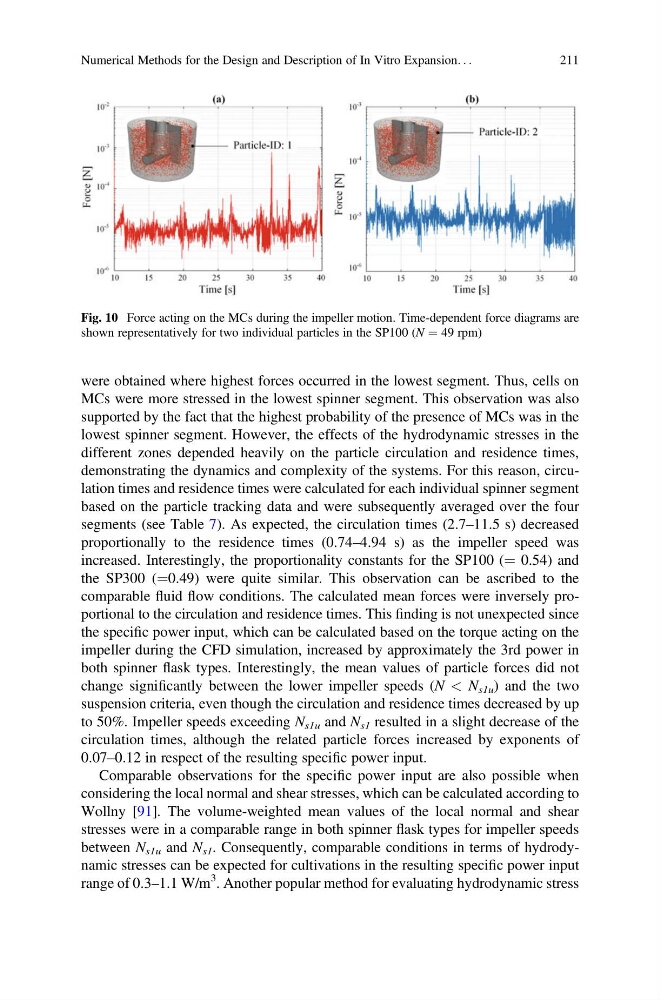
Fig. 10 Force acting on the MCs during the impeller motion. Time-dependent force diagrams are
shown representatively for two individual particles in the SP100 (N ¼ 49 rpm)
Numerical Methods for the Design and Description of In Vitro Expansion. . .
211
MCs were more stressed in the lowest spinner segment. This observation was also
supported by the fact that the highest probability of the presence of MCs was in the
lowest spinner segment. However, the effects of the hydrodynamic stresses in the
different zones depended heavily on the particle circulation and residence times,
demonstrating the dynamics and complexity of the systems. For this reason, circulation times and residence times were calculated for each individual spinner segment
based on the particle tracking data and were subsequently averaged over the four
segments (see Table 7). As expected, the circulation times (2.7–11.5 s) decreased
proportionally to the residence times (0.74–4.94 s) as the impeller speed was
increased. Interestingly, the proportionality constants for the SP100 (¼ 0.54) and
the SP300 (¼0.49) were quite similar. This observation can be ascribed to the
comparable fluid flow conditions. The calculated mean forces were inversely proportional to the circulation and residence times. This finding is not unexpected since
the specific power input, which can be calculated based on the torque acting on the
impeller during the CFD simulation, increased by approximately the 3rd power in
both spinner flask types. Interestingly, the mean values of particle forces did not
change significantly between the lower impeller speeds (N < N s1u ) and the two
suspension criteria, even though the circulation and residence times decreased by up
to 50%. Impeller speeds exceeding N s1u and N s1 resulted in a slight decrease of the
circulation times, although the related particle forces increased by exponents of
0.07–0.12 in respect of the resulting specific power input.
Comparable observations for the specific power input are also possible when
considering the local normal and shear stresses, which can be calculated according to
Wollny [91]. The volume-weighted mean values of the local normal and shear
stresses were in a comparable range in both spinner flask types for impeller speeds
between N s1u and N s1 . Consequently, comparable conditions in terms of hydrodynamic stresses can be expected for cultivations in the resulting specific power input
range of 0.3–1.1 W/m
3 . Another popular method for evaluating hydrodynamic stress
Fig. 10 Force acting on the MCs during the impeller motion. Time-dependent force diagrams are
shown representatively for two individual particles in the SP100 (N ¼ 49 rpm)
Numerical Methods for the Design and Description of In Vitro Expansion. . .
211