

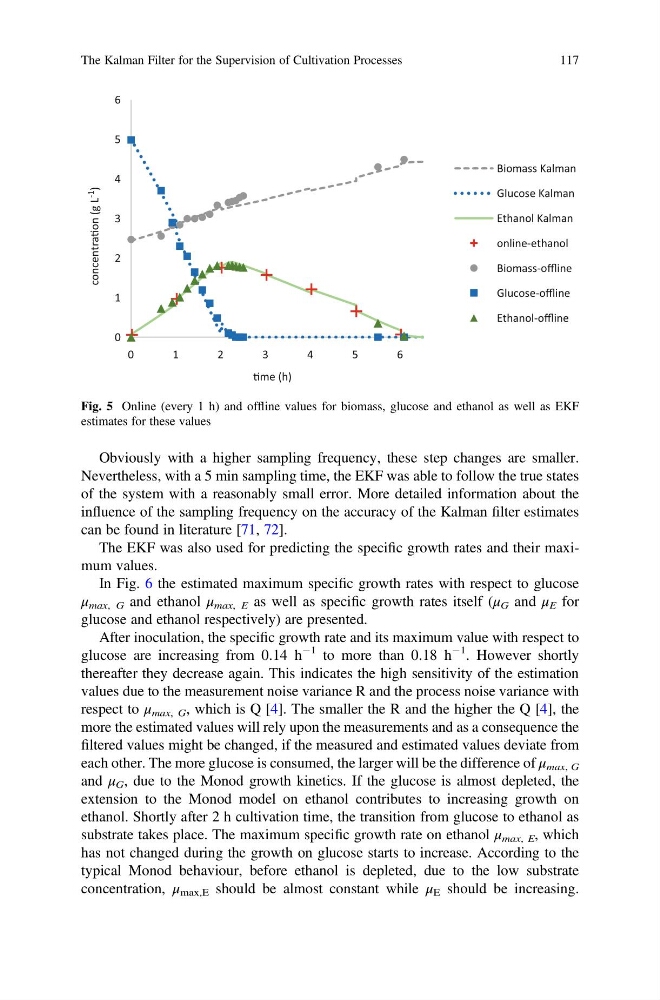
Obviously with a higher sampling frequency, these step changes are smaller.
Nevertheless, with a 5 min sampling time, the EKF was able to follow the true states
of the system with a reasonably small error. More detailed information about the
influence of the sampling frequency on the accuracy of the Kalman filter estimates
can be found in literature [71, 72].
The EKF was also used for predicting the specific growth rates and their maximum values.
In Fig. 6 the estimated maximum specific growth rates with respect to glucose
μ max, G and ethanol μ max, E as well as specific growth rates itself (μ G and μ E for
glucose and ethanol respectively) are presented.
After inoculation, the specific growth rate and its maximum value with respect to
glucose are increasing from 0.14 h
À1 to more than 0.18 h
À1 . However shortly
thereafter they decrease again. This indicates the high sensitivity of the estimation
values due to the measurement noise variance R and the process noise variance with
respect to μ max, G , which is Q [4]. The smaller the R and the higher the Q [4], the
more the estimated values will rely upon the measurements and as a consequence the
filtered values might be changed, if the measured and estimated values deviate from
each other. The more glucose is consumed, the larger will be the difference of μ max, G
and μ G , due to the Monod growth kinetics. If the glucose is almost depleted, the
extension to the Monod model on ethanol contributes to increasing growth on
ethanol. Shortly after 2 h cultivation time, the transition from glucose to ethanol as
substrate takes place. The maximum specific growth rate on ethanol μ max, E , which
has not changed during the growth on glucose starts to increase. According to the
typical Monod behaviour, before ethanol is depleted, due to the low substrate
concentration, μ max,E should be almost constant while μ E should be increasing.
0
1
2
3
4
5
6
0
1
2
3
4
5
6
Ɵme (h)
Biomass Kalman
Glucose Kalman
Ethanol Kalman
online-ethanol
Biomass-offline
Glucose-offline
Ethanol-offline
concentraƟon (g L -1
)
Fig. 5 Online (every 1 h) and offline values for biomass, glucose and ethanol as well as EKF
estimates for these values
The Kalman Filter for the Supervision of Cultivation Processes
117
Nevertheless, with a 5 min sampling time, the EKF was able to follow the true states
of the system with a reasonably small error. More detailed information about the
influence of the sampling frequency on the accuracy of the Kalman filter estimates
can be found in literature [71, 72].
The EKF was also used for predicting the specific growth rates and their maximum values.
In Fig. 6 the estimated maximum specific growth rates with respect to glucose
μ max, G and ethanol μ max, E as well as specific growth rates itself (μ G and μ E for
glucose and ethanol respectively) are presented.
After inoculation, the specific growth rate and its maximum value with respect to
glucose are increasing from 0.14 h
À1 to more than 0.18 h
À1 . However shortly
thereafter they decrease again. This indicates the high sensitivity of the estimation
values due to the measurement noise variance R and the process noise variance with
respect to μ max, G , which is Q [4]. The smaller the R and the higher the Q [4], the
more the estimated values will rely upon the measurements and as a consequence the
filtered values might be changed, if the measured and estimated values deviate from
each other. The more glucose is consumed, the larger will be the difference of μ max, G
and μ G , due to the Monod growth kinetics. If the glucose is almost depleted, the
extension to the Monod model on ethanol contributes to increasing growth on
ethanol. Shortly after 2 h cultivation time, the transition from glucose to ethanol as
substrate takes place. The maximum specific growth rate on ethanol μ max, E , which
has not changed during the growth on glucose starts to increase. According to the
typical Monod behaviour, before ethanol is depleted, due to the low substrate
concentration, μ max,E should be almost constant while μ E should be increasing.
0
1
2
3
4
5
6
0
1
2
3
4
5
6
Ɵme (h)
Biomass Kalman
Glucose Kalman
Ethanol Kalman
online-ethanol
Biomass-offline
Glucose-offline
Ethanol-offline
concentraƟon (g L -1
)
Fig. 5 Online (every 1 h) and offline values for biomass, glucose and ethanol as well as EKF
estimates for these values
The Kalman Filter for the Supervision of Cultivation Processes
117