

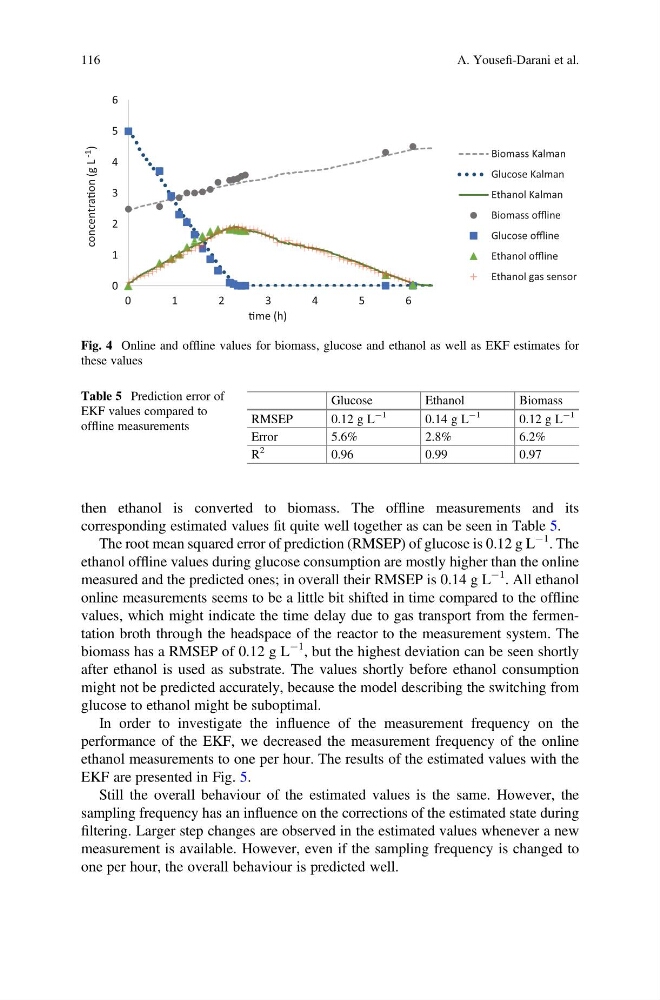
then ethanol is converted to biomass. The offline measurements and its
corresponding estimated values fit quite well together as can be seen in Table 5.
The root mean squared error of prediction (RMSEP) of glucose is 0.12 g L
À1 . The
ethanol offline values during glucose consumption are mostly higher than the online
measured and the predicted ones; in overall their RMSEP is 0.14 g L
À1 . All ethanol
online measurements seems to be a little bit shifted in time compared to the offline
values, which might indicate the time delay due to gas transport from the fermentation broth through the headspace of the reactor to the measurement system. The
biomass has a RMSEP of 0.12 g L
À1 , but the highest deviation can be seen shortly
after ethanol is used as substrate. The values shortly before ethanol consumption
might not be predicted accurately, because the model describing the switching from
glucose to ethanol might be suboptimal.
In order to investigate the influence of the measurement frequency on the
performance of the EKF, we decreased the measurement frequency of the online
ethanol measurements to one per hour. The results of the estimated values with the
EKF are presented in Fig. 5.
Still the overall behaviour of the estimated values is the same. However, the
sampling frequency has an influence on the corrections of the estimated state during
filtering. Larger step changes are observed in the estimated values whenever a new
measurement is available. However, even if the sampling frequency is changed to
one per hour, the overall behaviour is predicted well.
0
1
2
3
4
5
6
0
1
2
3
4
5
6
concentraƟon (g L -1
)
Ɵme (h)
Biomass Kalman
Glucose Kalman
Ethanol Kalman
Biomass offline
Glucose offline
Ethanol offline
Ethanol gas sensor
Fig. 4 Online and offline values for biomass, glucose and ethanol as well as EKF estimates for
these values
Table 5 Prediction error of
EKF values compared to
offline measurements
Glucose
Ethanol
Biomass
RMSEP
0.12 g L
À1
0.14 g L
À1
0.12 g L
À1
Error
5.6%
2.8%
6.2%
R
2
0.96
0.99
0.97
116
A. Yousefi-Darani et al.
corresponding estimated values fit quite well together as can be seen in Table 5.
The root mean squared error of prediction (RMSEP) of glucose is 0.12 g L
À1 . The
ethanol offline values during glucose consumption are mostly higher than the online
measured and the predicted ones; in overall their RMSEP is 0.14 g L
À1 . All ethanol
online measurements seems to be a little bit shifted in time compared to the offline
values, which might indicate the time delay due to gas transport from the fermentation broth through the headspace of the reactor to the measurement system. The
biomass has a RMSEP of 0.12 g L
À1 , but the highest deviation can be seen shortly
after ethanol is used as substrate. The values shortly before ethanol consumption
might not be predicted accurately, because the model describing the switching from
glucose to ethanol might be suboptimal.
In order to investigate the influence of the measurement frequency on the
performance of the EKF, we decreased the measurement frequency of the online
ethanol measurements to one per hour. The results of the estimated values with the
EKF are presented in Fig. 5.
Still the overall behaviour of the estimated values is the same. However, the
sampling frequency has an influence on the corrections of the estimated state during
filtering. Larger step changes are observed in the estimated values whenever a new
measurement is available. However, even if the sampling frequency is changed to
one per hour, the overall behaviour is predicted well.
0
1
2
3
4
5
6
0
1
2
3
4
5
6
concentraƟon (g L -1
)
Ɵme (h)
Biomass Kalman
Glucose Kalman
Ethanol Kalman
Biomass offline
Glucose offline
Ethanol offline
Ethanol gas sensor
Fig. 4 Online and offline values for biomass, glucose and ethanol as well as EKF estimates for
these values
Table 5 Prediction error of
EKF values compared to
offline measurements
Glucose
Ethanol
Biomass
RMSEP
0.12 g L
À1
0.14 g L
À1
0.12 g L
À1
Error
5.6%
2.8%
6.2%
R
2
0.96
0.99
0.97
116
A. Yousefi-Darani et al.