

48
2 RFID System Physical Anti-Collision Experimental Verification
T r (H ) = D xx + D yy
(2.16)
Det(H ) = D xx × D yy − D xy × D xy
(2.17)
T r (H )
2
D et (H )
=
(γ + ε)
2
γ ε
=
(γ + 1)
2
γ
(2.18)
(r + 1)
2
r increases with the increase of r , and the minimum value is obtained
when the two eigenvalues are equal. This point is retained when the ratio of the two
eigenvalues is less than (r + 1)
2
r .
(2) Describe feature points
After the accurate extremum point is obtained, the method of image gradient is
needed to obtain the reference direction of the local structure of the key points, that
is, the gradient amplitude and gradient direction of each key point are calculated,
so that the descriptors have invariance to the image transformation. The gradient
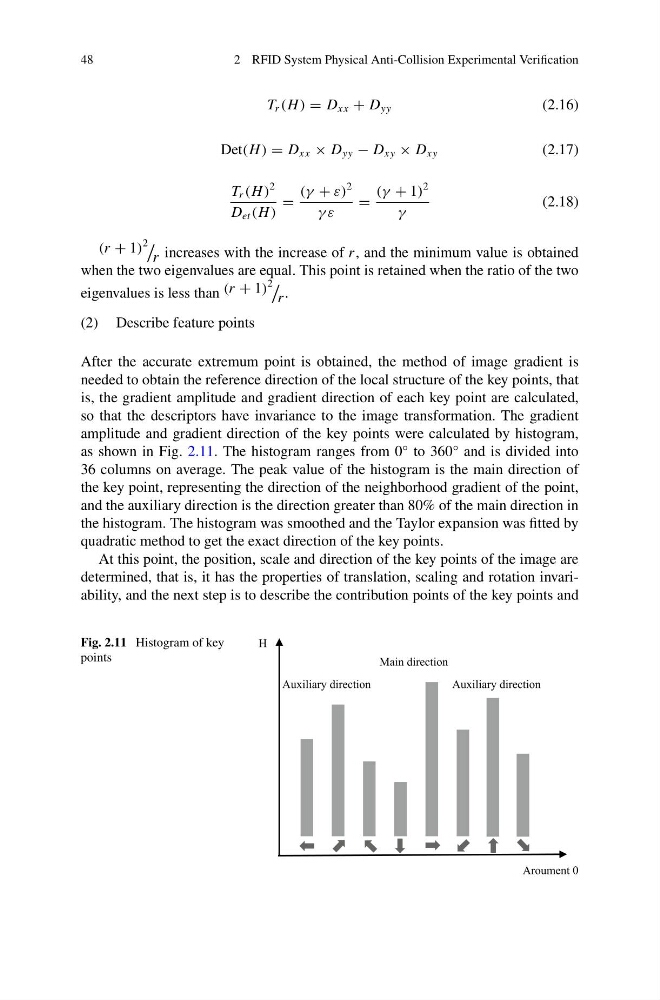
amplitude and gradient direction of the key points were calculated by histogram,
as shown in Fig. 2.11. The histogram ranges from 0° to 360° and is divided into
36 columns on average. The peak value of the histogram is the main direction of
the key point, representing the direction of the neighborhood gradient of the point,
and the auxiliary direction is the direction greater than 80% of the main direction in
the histogram. The histogram was smoothed and the Taylor expansion was fitted by
quadratic method to get the exact direction of the key points.
At this point, the position, scale and direction of the key points of the image are
determined, that is, it has the properties of translation, scaling and rotation invariability, and the next step is to describe the contribution points of the key points and
Fig. 2.11 Histogram of key
points
2 RFID System Physical Anti-Collision Experimental Verification
T r (H ) = D xx + D yy
(2.16)
Det(H ) = D xx × D yy − D xy × D xy
(2.17)
T r (H )
2
D et (H )
=
(γ + ε)
2
γ ε
=
(γ + 1)
2
γ
(2.18)
(r + 1)
2
r increases with the increase of r , and the minimum value is obtained
when the two eigenvalues are equal. This point is retained when the ratio of the two
eigenvalues is less than (r + 1)
2
r .
(2) Describe feature points
After the accurate extremum point is obtained, the method of image gradient is
needed to obtain the reference direction of the local structure of the key points, that
is, the gradient amplitude and gradient direction of each key point are calculated,
so that the descriptors have invariance to the image transformation. The gradient
amplitude and gradient direction of the key points were calculated by histogram,
as shown in Fig. 2.11. The histogram ranges from 0° to 360° and is divided into
36 columns on average. The peak value of the histogram is the main direction of
the key point, representing the direction of the neighborhood gradient of the point,
and the auxiliary direction is the direction greater than 80% of the main direction in
the histogram. The histogram was smoothed and the Taylor expansion was fitted by
quadratic method to get the exact direction of the key points.
At this point, the position, scale and direction of the key points of the image are
determined, that is, it has the properties of translation, scaling and rotation invariability, and the next step is to describe the contribution points of the key points and
Fig. 2.11 Histogram of key
points