

5.2 Physical Anti-Collision Based on Support Vector Machine (SVM)
181
Fig. 5.19 Subtle parameter selection
Table 5.2. R m is true reading distance, R p is predicted reading distance, and the
relative prediction error is given by
η =
R m − R p
R m
(5.39)
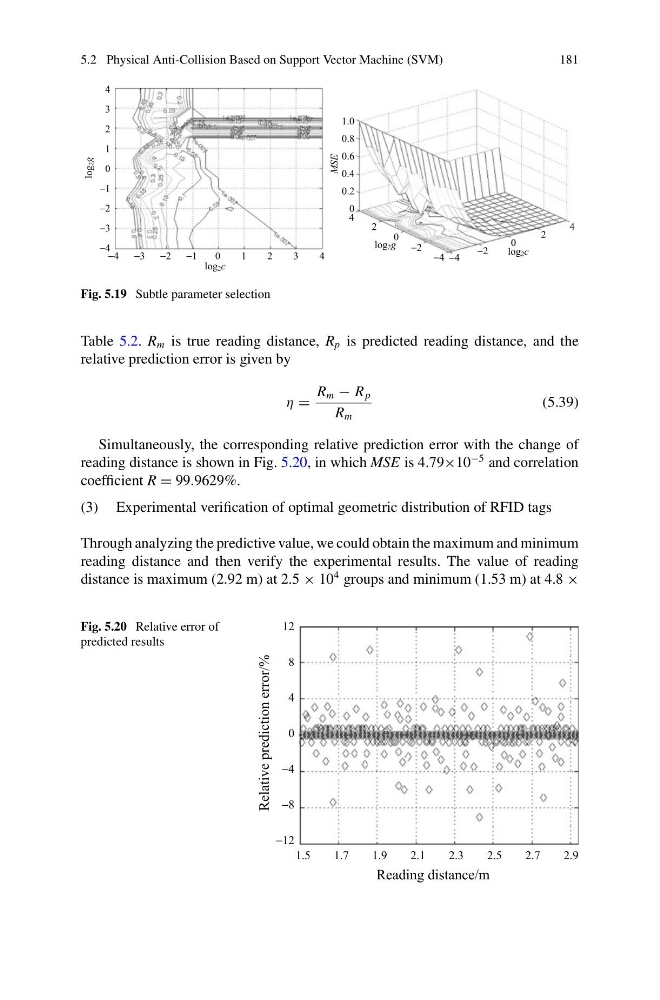
Simultaneously, the corresponding relative prediction error with the change of
reading distance is shown in Fig. 5.20, in which MSE is 4.79×10
−5 and correlation
coefficient R = 99.9629%.
(3) Experimental verification of optimal geometric distribution of RFID tags
Through analyzing the predictive value, we could obtain the maximum and minimum
reading distance and then verify the experimental results. The value of reading
distance is maximum (2.92 m) at 2.5 × 10
4 groups and minimum (1.53 m) at 4.8 ×
Fig. 5.20 Relative error of
predicted results
181
Fig. 5.19 Subtle parameter selection
Table 5.2. R m is true reading distance, R p is predicted reading distance, and the
relative prediction error is given by
η =
R m − R p
R m
(5.39)
Simultaneously, the corresponding relative prediction error with the change of
reading distance is shown in Fig. 5.20, in which MSE is 4.79×10
−5 and correlation
coefficient R = 99.9629%.
(3) Experimental verification of optimal geometric distribution of RFID tags
Through analyzing the predictive value, we could obtain the maximum and minimum
reading distance and then verify the experimental results. The value of reading
distance is maximum (2.92 m) at 2.5 × 10
4 groups and minimum (1.53 m) at 4.8 ×
Fig. 5.20 Relative error of
predicted results