

182
5 Optimization Algorithm and RFID System Physical Anti-Collision
Table 5.3 Experimental verification
x 1 /m
y 1 /m
x 2 /m
y 2 /m
x 3 /m
y 3 /m
R m /m
R p /m
η/ %
0.010
0.102
0.083
0.053
−0.087
−0.055
2.91
2.92
−0.34
0.008
0.095
0.083
0.052
−0.092
−0.063
2.90
2.92
−0.68
0.012
0.004
0.112
0.002
0.102
0.011
1.51
1.53
−1.32
10
3 groups in 1.7 × 10
11 groups. Three particular groups are chosen to verify and
test steps are as follows:
(1) The RFID tags are attached on the goods according to test distribution.
(2) The cycle indexes of tray are set 10 times and the experimental data is statistical
average to ensure the reliability of reading distance.
(3) The reading distances of different tags’ location are measured.
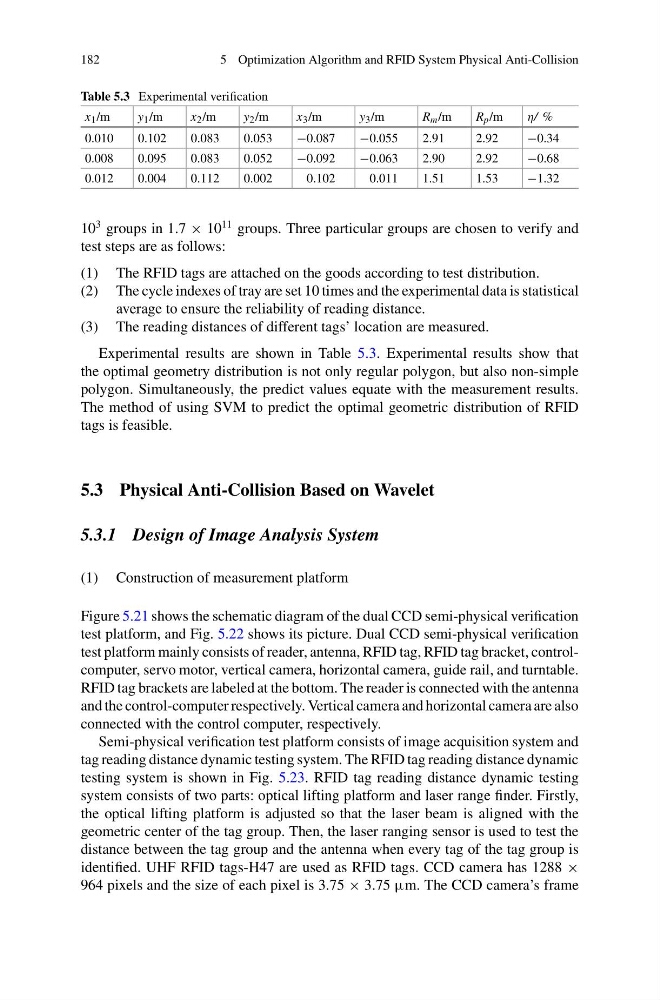
Experimental results are shown in Table 5.3. Experimental results show that
the optimal geometry distribution is not only regular polygon, but also non-simple
polygon. Simultaneously, the predict values equate with the measurement results.
The method of using SVM to predict the optimal geometric distribution of RFID
tags is feasible.
5.3 Physical Anti-Collision Based on Wavelet
5.3.1 Design of Image Analysis System
(1) Construction of measurement platform
Figure 5.21 shows the schematic diagram of the dual CCD semi-physical verification
test platform, and Fig. 5.22 shows its picture. Dual CCD semi-physical verification
test platform mainly consists of reader, antenna, RFID tag, RFID tag bracket, controlcomputer, servo motor, vertical camera, horizontal camera, guide rail, and turntable.
RFID tag brackets are labeled at the bottom. The reader is connected with the antenna
and the control-computer respectively. Vertical camera and horizontal camera are also
connected with the control computer, respectively.
Semi-physical verification test platform consists of image acquisition system and
tag reading distance dynamic testing system. The RFID tag reading distance dynamic
testing system is shown in Fig. 5.23. RFID tag reading distance dynamic testing
system consists of two parts: optical lifting platform and laser range finder. Firstly,
the optical lifting platform is adjusted so that the laser beam is aligned with the
geometric center of the tag group. Then, the laser ranging sensor is used to test the
distance between the tag group and the antenna when every tag of the tag group is
identified. UHF RFID tags-H47 are used as RFID tags. CCD camera has 1288 ×
964 pixels and the size of each pixel is 3.75 × 3.75 μm. The CCD camera’s frame
5 Optimization Algorithm and RFID System Physical Anti-Collision
Table 5.3 Experimental verification
x 1 /m
y 1 /m
x 2 /m
y 2 /m
x 3 /m
y 3 /m
R m /m
R p /m
η/ %
0.010
0.102
0.083
0.053
−0.087
−0.055
2.91
2.92
−0.34
0.008
0.095
0.083
0.052
−0.092
−0.063
2.90
2.92
−0.68
0.012
0.004
0.112
0.002
0.102
0.011
1.51
1.53
−1.32
10
3 groups in 1.7 × 10
11 groups. Three particular groups are chosen to verify and
test steps are as follows:
(1) The RFID tags are attached on the goods according to test distribution.
(2) The cycle indexes of tray are set 10 times and the experimental data is statistical
average to ensure the reliability of reading distance.
(3) The reading distances of different tags’ location are measured.
Experimental results are shown in Table 5.3. Experimental results show that
the optimal geometry distribution is not only regular polygon, but also non-simple
polygon. Simultaneously, the predict values equate with the measurement results.
The method of using SVM to predict the optimal geometric distribution of RFID
tags is feasible.
5.3 Physical Anti-Collision Based on Wavelet
5.3.1 Design of Image Analysis System
(1) Construction of measurement platform
Figure 5.21 shows the schematic diagram of the dual CCD semi-physical verification
test platform, and Fig. 5.22 shows its picture. Dual CCD semi-physical verification
test platform mainly consists of reader, antenna, RFID tag, RFID tag bracket, controlcomputer, servo motor, vertical camera, horizontal camera, guide rail, and turntable.
RFID tag brackets are labeled at the bottom. The reader is connected with the antenna
and the control-computer respectively. Vertical camera and horizontal camera are also
connected with the control computer, respectively.
Semi-physical verification test platform consists of image acquisition system and
tag reading distance dynamic testing system. The RFID tag reading distance dynamic
testing system is shown in Fig. 5.23. RFID tag reading distance dynamic testing
system consists of two parts: optical lifting platform and laser range finder. Firstly,
the optical lifting platform is adjusted so that the laser beam is aligned with the
geometric center of the tag group. Then, the laser ranging sensor is used to test the
distance between the tag group and the antenna when every tag of the tag group is
identified. UHF RFID tags-H47 are used as RFID tags. CCD camera has 1288 ×
964 pixels and the size of each pixel is 3.75 × 3.75 μm. The CCD camera’s frame