

170
5 Optimization Algorithm and RFID System Physical Anti-Collision
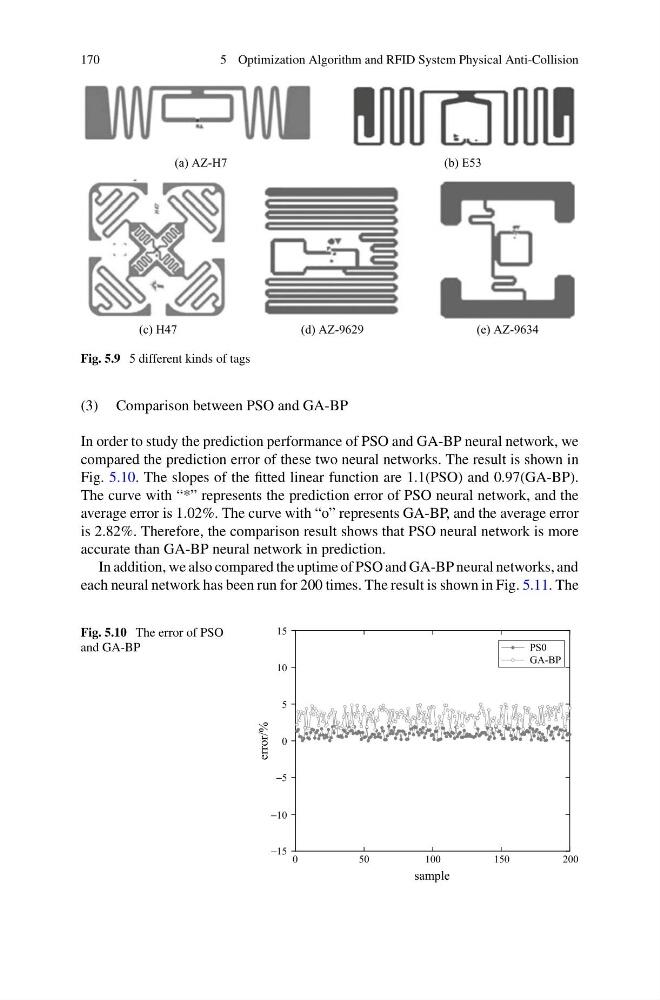
Fig. 5.9 5 different kinds of tags
(3) Comparison between PSO and GA-BP
In order to study the prediction performance of PSO and GA-BP neural network, we
compared the prediction error of these two neural networks. The result is shown in
Fig. 5.10. The slopes of the fitted linear function are 1.1(PSO) and 0.97(GA-BP).
The curve with “*” represents the prediction error of PSO neural network, and the
average error is 1.02%. The curve with “o” represents GA-BP, and the average error
is 2.82%. Therefore, the comparison result shows that PSO neural network is more
accurate than GA-BP neural network in prediction.
In addition, we also compared the uptime of PSO and GA-BP neural networks, and
each neural network has been run for 200 times. The result is shown in Fig. 5.11. The
Fig. 5.10 The error of PSO
and GA-BP
5 Optimization Algorithm and RFID System Physical Anti-Collision
Fig. 5.9 5 different kinds of tags
(3) Comparison between PSO and GA-BP
In order to study the prediction performance of PSO and GA-BP neural network, we
compared the prediction error of these two neural networks. The result is shown in
Fig. 5.10. The slopes of the fitted linear function are 1.1(PSO) and 0.97(GA-BP).
The curve with “*” represents the prediction error of PSO neural network, and the
average error is 1.02%. The curve with “o” represents GA-BP, and the average error
is 2.82%. Therefore, the comparison result shows that PSO neural network is more
accurate than GA-BP neural network in prediction.
In addition, we also compared the uptime of PSO and GA-BP neural networks, and
each neural network has been run for 200 times. The result is shown in Fig. 5.11. The
Fig. 5.10 The error of PSO
and GA-BP