

5.1 Physical anti-Collision based on Particle Swarm Optimization (PSO)
169
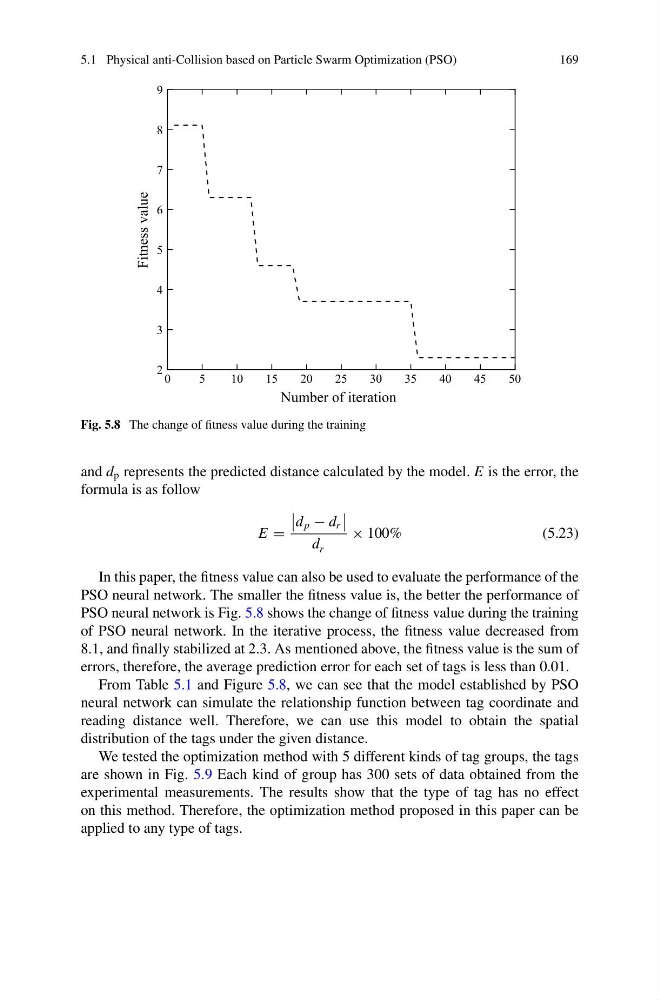
Fig. 5.8 The change of fitness value during the training
and d p represents the predicted distance calculated by the model. E is the error, the
formula is as follow
E =
d p − d r
d r
× 100%
(5.23)
In this paper, the fitness value can also be used to evaluate the performance of the
PSO neural network. The smaller the fitness value is, the better the performance of
PSO neural network is Fig. 5.8 shows the change of fitness value during the training
of PSO neural network. In the iterative process, the fitness value decreased from
8.1, and finally stabilized at 2.3. As mentioned above, the fitness value is the sum of
errors, therefore, the average prediction error for each set of tags is less than 0.01.
From Table 5.1 and Figure 5.8, we can see that the model established by PSO
neural network can simulate the relationship function between tag coordinate and
reading distance well. Therefore, we can use this model to obtain the spatial
distribution of the tags under the given distance.
We tested the optimization method with 5 different kinds of tag groups, the tags
are shown in Fig. 5.9 Each kind of group has 300 sets of data obtained from the
experimental measurements. The results show that the type of tag has no effect
on this method. Therefore, the optimization method proposed in this paper can be
applied to any type of tags.
169
Fig. 5.8 The change of fitness value during the training
and d p represents the predicted distance calculated by the model. E is the error, the
formula is as follow
E =
d p − d r
d r
× 100%
(5.23)
In this paper, the fitness value can also be used to evaluate the performance of the
PSO neural network. The smaller the fitness value is, the better the performance of
PSO neural network is Fig. 5.8 shows the change of fitness value during the training
of PSO neural network. In the iterative process, the fitness value decreased from
8.1, and finally stabilized at 2.3. As mentioned above, the fitness value is the sum of
errors, therefore, the average prediction error for each set of tags is less than 0.01.
From Table 5.1 and Figure 5.8, we can see that the model established by PSO
neural network can simulate the relationship function between tag coordinate and
reading distance well. Therefore, we can use this model to obtain the spatial
distribution of the tags under the given distance.
We tested the optimization method with 5 different kinds of tag groups, the tags
are shown in Fig. 5.9 Each kind of group has 300 sets of data obtained from the
experimental measurements. The results show that the type of tag has no effect
on this method. Therefore, the optimization method proposed in this paper can be
applied to any type of tags.