

4.5 Novel Reverse Design Method of Tag Antenna Based on Image Analysis
153
the arm length has an effect on the antenna performance higher than the antenna line
width. The center position changes within a certain range, but the change is not large.
The radiation direction of the antenna is basically unchanged.
The length of the antenna bend may affect the performance of the antenna. In
the above, when L 2 + L 3 = 70 mm, the radiation of the antenna is the strongest.
Different SAR images can be obtained by guaranteeing L 2 + L 3 = 70 mm and
changing the lengths of L 2 and L 3 . After image processing, the extracted features
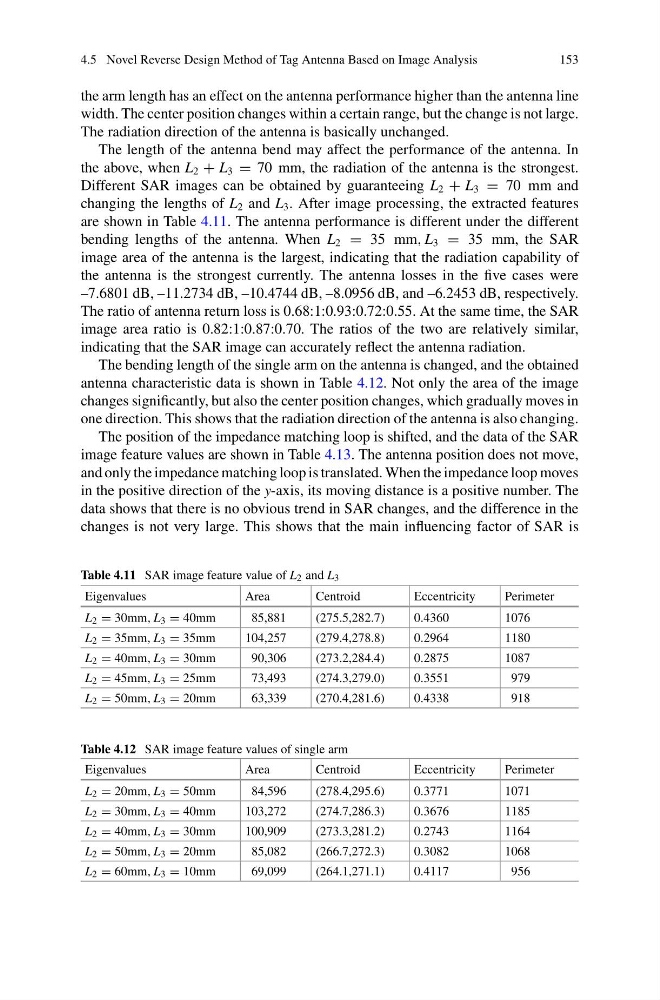
are shown in Table 4.11. The antenna performance is different under the different
bending lengths of the antenna. When L 2 = 35 mm, L 3 = 35 mm, the SAR
image area of the antenna is the largest, indicating that the radiation capability of
the antenna is the strongest currently. The antenna losses in the five cases were
–7.6801 dB, –11.2734 dB, –10.4744 dB, –8.0956 dB, and –6.2453 dB, respectively.
The ratio of antenna return loss is 0.68:1:0.93:0.72:0.55. At the same time, the SAR
image area ratio is 0.82:1:0.87:0.70. The ratios of the two are relatively similar,
indicating that the SAR image can accurately reflect the antenna radiation.
The bending length of the single arm on the antenna is changed, and the obtained
antenna characteristic data is shown in Table 4.12. Not only the area of the image
changes significantly, but also the center position changes, which gradually moves in
one direction. This shows that the radiation direction of the antenna is also changing.
The position of the impedance matching loop is shifted, and the data of the SAR
image feature values are shown in Table 4.13. The antenna position does not move,
and only the impedance matching loop is translated. When the impedance loop moves
in the positive direction of the y-axis, its moving distance is a positive number. The
data shows that there is no obvious trend in SAR changes, and the difference in the
changes is not very large. This shows that the main influencing factor of SAR is
Table 4.11 SAR image feature value of L 2 and L 3
Eigenvalues
Area
Centroid
Eccentricity
Perimeter
L 2 = 30mm, L 3 = 40mm
85,881
(275.5,282.7)
0.4360
1076
L 2 = 35mm, L 3 = 35mm
104,257
(279.4,278.8)
0.2964
1180
L 2 = 40mm, L 3 = 30mm
90,306
(273.2,284.4)
0.2875
1087
L 2 = 45mm, L 3 = 25mm
73,493
(274.3,279.0)
0.3551
979
L 2 = 50mm, L 3 = 20mm
63,339
(270.4,281.6)
0.4338
918
Table 4.12 SAR image feature values of single arm
Eigenvalues
Area
Centroid
Eccentricity
Perimeter
L 2 = 20mm, L 3 = 50mm
84,596
(278.4,295.6)
0.3771
1071
L 2 = 30mm, L 3 = 40mm
103,272
(274.7,286.3)
0.3676
1185
L 2 = 40mm, L 3 = 30mm
100,909
(273.3,281.2)
0.2743
1164
L 2 = 50mm, L 3 = 20mm
85,082
(266.7,272.3)
0.3082
1068
L 2 = 60mm, L 3 = 10mm
69,099
(264.1,271.1)
0.4117
956
153
the arm length has an effect on the antenna performance higher than the antenna line
width. The center position changes within a certain range, but the change is not large.
The radiation direction of the antenna is basically unchanged.
The length of the antenna bend may affect the performance of the antenna. In
the above, when L 2 + L 3 = 70 mm, the radiation of the antenna is the strongest.
Different SAR images can be obtained by guaranteeing L 2 + L 3 = 70 mm and
changing the lengths of L 2 and L 3 . After image processing, the extracted features
are shown in Table 4.11. The antenna performance is different under the different
bending lengths of the antenna. When L 2 = 35 mm, L 3 = 35 mm, the SAR
image area of the antenna is the largest, indicating that the radiation capability of
the antenna is the strongest currently. The antenna losses in the five cases were
–7.6801 dB, –11.2734 dB, –10.4744 dB, –8.0956 dB, and –6.2453 dB, respectively.
The ratio of antenna return loss is 0.68:1:0.93:0.72:0.55. At the same time, the SAR
image area ratio is 0.82:1:0.87:0.70. The ratios of the two are relatively similar,
indicating that the SAR image can accurately reflect the antenna radiation.
The bending length of the single arm on the antenna is changed, and the obtained
antenna characteristic data is shown in Table 4.12. Not only the area of the image
changes significantly, but also the center position changes, which gradually moves in
one direction. This shows that the radiation direction of the antenna is also changing.
The position of the impedance matching loop is shifted, and the data of the SAR
image feature values are shown in Table 4.13. The antenna position does not move,
and only the impedance matching loop is translated. When the impedance loop moves
in the positive direction of the y-axis, its moving distance is a positive number. The
data shows that there is no obvious trend in SAR changes, and the difference in the
changes is not very large. This shows that the main influencing factor of SAR is
Table 4.11 SAR image feature value of L 2 and L 3
Eigenvalues
Area
Centroid
Eccentricity
Perimeter
L 2 = 30mm, L 3 = 40mm
85,881
(275.5,282.7)
0.4360
1076
L 2 = 35mm, L 3 = 35mm
104,257
(279.4,278.8)
0.2964
1180
L 2 = 40mm, L 3 = 30mm
90,306
(273.2,284.4)
0.2875
1087
L 2 = 45mm, L 3 = 25mm
73,493
(274.3,279.0)
0.3551
979
L 2 = 50mm, L 3 = 20mm
63,339
(270.4,281.6)
0.4338
918
Table 4.12 SAR image feature values of single arm
Eigenvalues
Area
Centroid
Eccentricity
Perimeter
L 2 = 20mm, L 3 = 50mm
84,596
(278.4,295.6)
0.3771
1071
L 2 = 30mm, L 3 = 40mm
103,272
(274.7,286.3)
0.3676
1185
L 2 = 40mm, L 3 = 30mm
100,909
(273.3,281.2)
0.2743
1164
L 2 = 50mm, L 3 = 20mm
85,082
(266.7,272.3)
0.3082
1068
L 2 = 60mm, L 3 = 10mm
69,099
(264.1,271.1)
0.4117
956