

152
4 Image Theory of RFID System Physical Anti-Collision
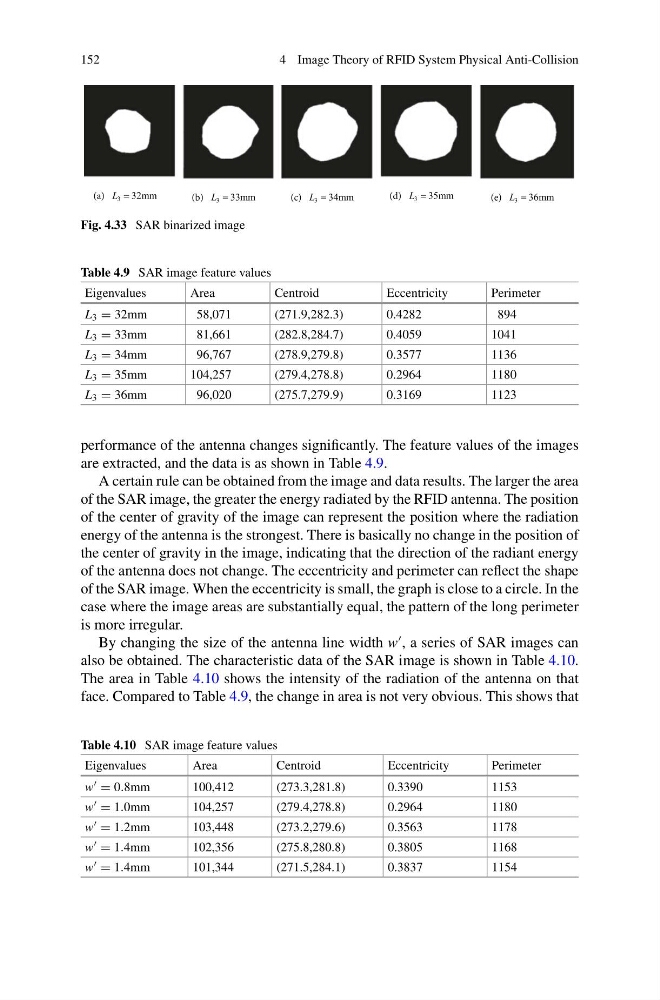
Fig. 4.33 SAR binarized image
Table 4.9 SAR image feature values
Eigenvalues
Area
Centroid
Eccentricity
Perimeter
L 3 = 32mm
58,071
(271.9,282.3)
0.4282
894
L 3 = 33mm
81,661
(282.8,284.7)
0.4059
1041
L 3 = 34mm
96,767
(278.9,279.8)
0.3577
1136
L 3 = 35mm
104,257
(279.4,278.8)
0.2964
1180
L 3 = 36mm
96,020
(275.7,279.9)
0.3169
1123
performance of the antenna changes significantly. The feature values of the images
are extracted, and the data is as shown in Table 4.9.
A certain rule can be obtained from the image and data results. The larger the area
of the SAR image, the greater the energy radiated by the RFID antenna. The position
of the center of gravity of the image can represent the position where the radiation
energy of the antenna is the strongest. There is basically no change in the position of
the center of gravity in the image, indicating that the direction of the radiant energy
of the antenna does not change. The eccentricity and perimeter can reflect the shape
of the SAR image. When the eccentricity is small, the graph is close to a circle. In the
case where the image areas are substantially equal, the pattern of the long perimeter
is more irregular.
By changing the size of the antenna line width w
, a series of SAR images can
also be obtained. The characteristic data of the SAR image is shown in Table 4.10.
The area in Table 4.10 shows the intensity of the radiation of the antenna on that
face. Compared to Table 4.9, the change in area is not very obvious. This shows that
Table 4.10 SAR image feature values
Eigenvalues
Area
Centroid
Eccentricity
Perimeter
w = 0.8mm
100,412
(273.3,281.8)
0.3390
1153
w = 1.0mm
104,257
(279.4,278.8)
0.2964
1180
w = 1.2mm
103,448
(273.2,279.6)
0.3563
1178
w = 1.4mm
102,356
(275.8,280.8)
0.3805
1168
w = 1.4mm
101,344
(271.5,284.1)
0.3837
1154
4 Image Theory of RFID System Physical Anti-Collision
Fig. 4.33 SAR binarized image
Table 4.9 SAR image feature values
Eigenvalues
Area
Centroid
Eccentricity
Perimeter
L 3 = 32mm
58,071
(271.9,282.3)
0.4282
894
L 3 = 33mm
81,661
(282.8,284.7)
0.4059
1041
L 3 = 34mm
96,767
(278.9,279.8)
0.3577
1136
L 3 = 35mm
104,257
(279.4,278.8)
0.2964
1180
L 3 = 36mm
96,020
(275.7,279.9)
0.3169
1123
performance of the antenna changes significantly. The feature values of the images
are extracted, and the data is as shown in Table 4.9.
A certain rule can be obtained from the image and data results. The larger the area
of the SAR image, the greater the energy radiated by the RFID antenna. The position
of the center of gravity of the image can represent the position where the radiation
energy of the antenna is the strongest. There is basically no change in the position of
the center of gravity in the image, indicating that the direction of the radiant energy
of the antenna does not change. The eccentricity and perimeter can reflect the shape
of the SAR image. When the eccentricity is small, the graph is close to a circle. In the
case where the image areas are substantially equal, the pattern of the long perimeter
is more irregular.
By changing the size of the antenna line width w
, a series of SAR images can
also be obtained. The characteristic data of the SAR image is shown in Table 4.10.
The area in Table 4.10 shows the intensity of the radiation of the antenna on that
face. Compared to Table 4.9, the change in area is not very obvious. This shows that
Table 4.10 SAR image feature values
Eigenvalues
Area
Centroid
Eccentricity
Perimeter
w = 0.8mm
100,412
(273.3,281.8)
0.3390
1153
w = 1.0mm
104,257
(279.4,278.8)
0.2964
1180
w = 1.2mm
103,448
(273.2,279.6)
0.3563
1178
w = 1.4mm
102,356
(275.8,280.8)
0.3805
1168
w = 1.4mm
101,344
(271.5,284.1)
0.3837
1154