

4.5 Novel Reverse Design Method of Tag Antenna Based on Image Analysis
151
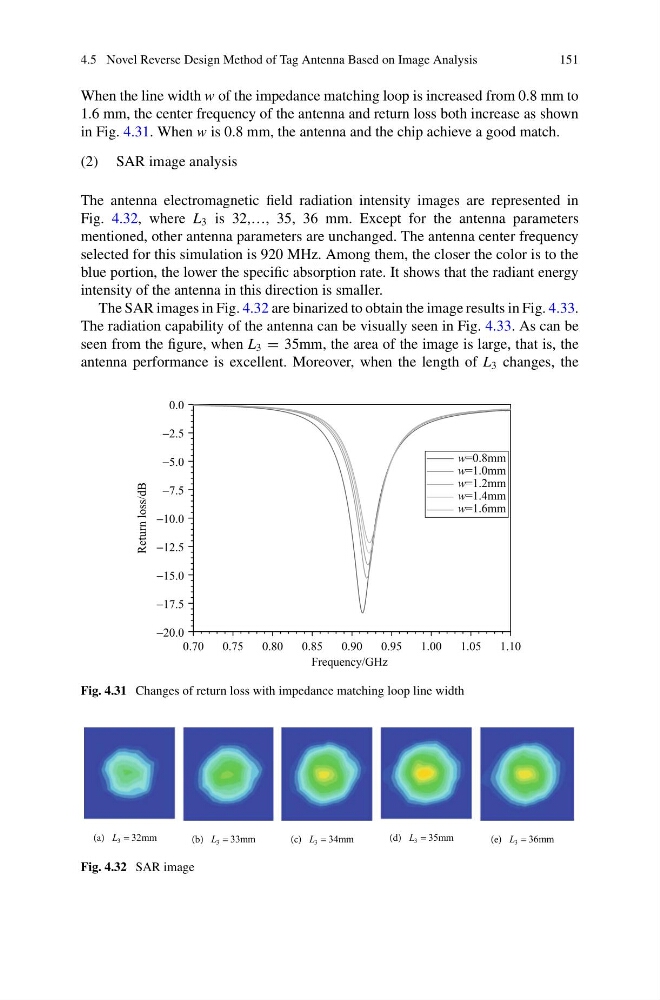
When the line width w of the impedance matching loop is increased from 0.8 mm to
1.6 mm, the center frequency of the antenna and return loss both increase as shown
in Fig. 4.31. When w is 0.8 mm, the antenna and the chip achieve a good match.
(2) SAR image analysis
The antenna electromagnetic field radiation intensity images are represented in
Fig. 4.32, where L 3 is 32,…, 35, 36 mm. Except for the antenna parameters
mentioned, other antenna parameters are unchanged. The antenna center frequency
selected for this simulation is 920 MHz. Among them, the closer the color is to the
blue portion, the lower the specific absorption rate. It shows that the radiant energy
intensity of the antenna in this direction is smaller.
The SAR images in Fig. 4.32 are binarized to obtain the image results in Fig. 4.33.
The radiation capability of the antenna can be visually seen in Fig. 4.33. As can be
seen from the figure, when L 3 = 35mm, the area of the image is large, that is, the
antenna performance is excellent. Moreover, when the length of L 3 changes, the
Fig. 4.31 Changes of return loss with impedance matching loop line width
Fig. 4.32 SAR image
151
When the line width w of the impedance matching loop is increased from 0.8 mm to
1.6 mm, the center frequency of the antenna and return loss both increase as shown
in Fig. 4.31. When w is 0.8 mm, the antenna and the chip achieve a good match.
(2) SAR image analysis
The antenna electromagnetic field radiation intensity images are represented in
Fig. 4.32, where L 3 is 32,…, 35, 36 mm. Except for the antenna parameters
mentioned, other antenna parameters are unchanged. The antenna center frequency
selected for this simulation is 920 MHz. Among them, the closer the color is to the
blue portion, the lower the specific absorption rate. It shows that the radiant energy
intensity of the antenna in this direction is smaller.
The SAR images in Fig. 4.32 are binarized to obtain the image results in Fig. 4.33.
The radiation capability of the antenna can be visually seen in Fig. 4.33. As can be
seen from the figure, when L 3 = 35mm, the area of the image is large, that is, the
antenna performance is excellent. Moreover, when the length of L 3 changes, the
Fig. 4.31 Changes of return loss with impedance matching loop line width
Fig. 4.32 SAR image