

126
4 Image Theory of RFID System Physical Anti-Collision
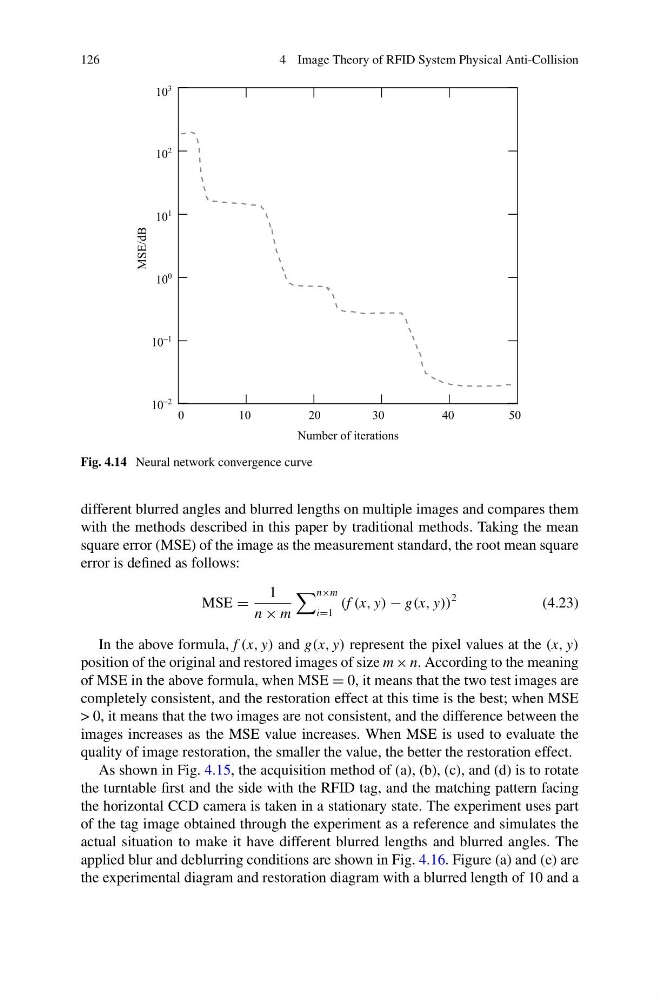
Fig. 4.14 Neural network convergence curve
different blurred angles and blurred lengths on multiple images and compares them
with the methods described in this paper by traditional methods. Taking the mean
square error (MSE) of the image as the measurement standard, the root mean square
error is defined as follows:
MSE =
1
n × m
n×m
i=1
(f (x, y) − g(x, y))
2
(4.23)
In the above formula, f (x, y) and g(x, y) represent the pixel values at the (x, y)
position of the original and restored images of size m × n. According to the meaning
of MSE in the above formula, when MSE = 0, it means that the two test images are
completely consistent, and the restoration effect at this time is the best; when MSE
> 0, it means that the two images are not consistent, and the difference between the
images increases as the MSE value increases. When MSE is used to evaluate the
quality of image restoration, the smaller the value, the better the restoration effect.
As shown in Fig. 4.15, the acquisition method of (a), (b), (c), and (d) is to rotate
the turntable first and the side with the RFID tag, and the matching pattern facing
the horizontal CCD camera is taken in a stationary state. The experiment uses part
of the tag image obtained through the experiment as a reference and simulates the
actual situation to make it have different blurred lengths and blurred angles. The
applied blur and deblurring conditions are shown in Fig. 4.16. Figure (a) and (e) are
the experimental diagram and restoration diagram with a blurred length of 10 and a
4 Image Theory of RFID System Physical Anti-Collision
Fig. 4.14 Neural network convergence curve
different blurred angles and blurred lengths on multiple images and compares them
with the methods described in this paper by traditional methods. Taking the mean
square error (MSE) of the image as the measurement standard, the root mean square
error is defined as follows:
MSE =
1
n × m
n×m
i=1
(f (x, y) − g(x, y))
2
(4.23)
In the above formula, f (x, y) and g(x, y) represent the pixel values at the (x, y)
position of the original and restored images of size m × n. According to the meaning
of MSE in the above formula, when MSE = 0, it means that the two test images are
completely consistent, and the restoration effect at this time is the best; when MSE
> 0, it means that the two images are not consistent, and the difference between the
images increases as the MSE value increases. When MSE is used to evaluate the
quality of image restoration, the smaller the value, the better the restoration effect.
As shown in Fig. 4.15, the acquisition method of (a), (b), (c), and (d) is to rotate
the turntable first and the side with the RFID tag, and the matching pattern facing
the horizontal CCD camera is taken in a stationary state. The experiment uses part
of the tag image obtained through the experiment as a reference and simulates the
actual situation to make it have different blurred lengths and blurred angles. The
applied blur and deblurring conditions are shown in Fig. 4.16. Figure (a) and (e) are
the experimental diagram and restoration diagram with a blurred length of 10 and a