

4.2 Image Processing in Multi-tag Movement
125
ˆ
Y (X ) =
n
i=1 Y i exp
−
(X −X i )
T (X −X i )
2σ 2
n
i=1 exp
−
(X −X i )
T (X −X i )
2σ 2
(4.22)
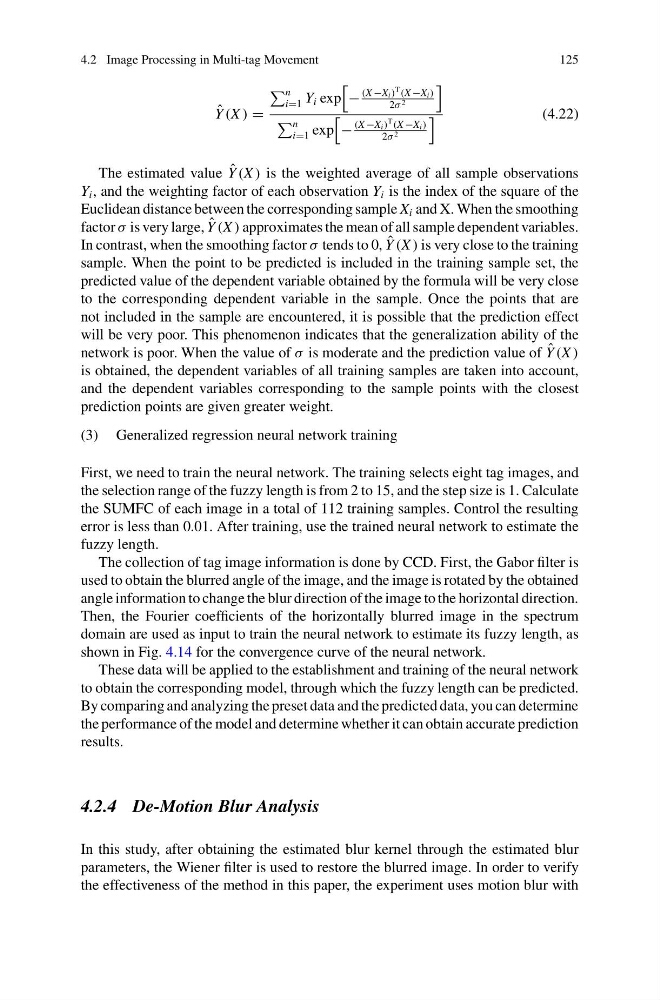
The estimated value ˆ
Y (X ) is the weighted average of all sample observations
Y i , and the weighting factor of each observation Y i is the index of the square of the
Euclidean distance between the corresponding sample X i and X. When the smoothing
factor σ is very large, ˆ
Y (X ) approximates the mean of all sample dependent variables.
In contrast, when the smoothing factor σ tends to 0, ˆ
Y (X ) is very close to the training
sample. When the point to be predicted is included in the training sample set, the
predicted value of the dependent variable obtained by the formula will be very close
to the corresponding dependent variable in the sample. Once the points that are
not included in the sample are encountered, it is possible that the prediction effect
will be very poor. This phenomenon indicates that the generalization ability of the
network is poor. When the value of σ is moderate and the prediction value of ˆ
Y (X )
is obtained, the dependent variables of all training samples are taken into account,
and the dependent variables corresponding to the sample points with the closest
prediction points are given greater weight.
(3) Generalized regression neural network training
First, we need to train the neural network. The training selects eight tag images, and
the selection range of the fuzzy length is from 2 to 15, and the step size is 1. Calculate
the SUMFC of each image in a total of 112 training samples. Control the resulting
error is less than 0.01. After training, use the trained neural network to estimate the
fuzzy length.
The collection of tag image information is done by CCD. First, the Gabor filter is
used to obtain the blurred angle of the image, and the image is rotated by the obtained
angle information to change the blur direction of the image to the horizontal direction.
Then, the Fourier coefficients of the horizontally blurred image in the spectrum
domain are used as input to train the neural network to estimate its fuzzy length, as
shown in Fig. 4.14 for the convergence curve of the neural network.
These data will be applied to the establishment and training of the neural network
to obtain the corresponding model, through which the fuzzy length can be predicted.
By comparing and analyzing the preset data and the predicted data, you can determine
the performance of the model and determine whether it can obtain accurate prediction
results.
4.2.4 De-Motion Blur Analysis
In this study, after obtaining the estimated blur kernel through the estimated blur
parameters, the Wiener filter is used to restore the blurred image. In order to verify
the effectiveness of the method in this paper, the experiment uses motion blur with
125
ˆ
Y (X ) =
n
i=1 Y i exp
−
(X −X i )
T (X −X i )
2σ 2
n
i=1 exp
−
(X −X i )
T (X −X i )
2σ 2
(4.22)
The estimated value ˆ
Y (X ) is the weighted average of all sample observations
Y i , and the weighting factor of each observation Y i is the index of the square of the
Euclidean distance between the corresponding sample X i and X. When the smoothing
factor σ is very large, ˆ
Y (X ) approximates the mean of all sample dependent variables.
In contrast, when the smoothing factor σ tends to 0, ˆ
Y (X ) is very close to the training
sample. When the point to be predicted is included in the training sample set, the
predicted value of the dependent variable obtained by the formula will be very close
to the corresponding dependent variable in the sample. Once the points that are
not included in the sample are encountered, it is possible that the prediction effect
will be very poor. This phenomenon indicates that the generalization ability of the
network is poor. When the value of σ is moderate and the prediction value of ˆ
Y (X )
is obtained, the dependent variables of all training samples are taken into account,
and the dependent variables corresponding to the sample points with the closest
prediction points are given greater weight.
(3) Generalized regression neural network training
First, we need to train the neural network. The training selects eight tag images, and
the selection range of the fuzzy length is from 2 to 15, and the step size is 1. Calculate
the SUMFC of each image in a total of 112 training samples. Control the resulting
error is less than 0.01. After training, use the trained neural network to estimate the
fuzzy length.
The collection of tag image information is done by CCD. First, the Gabor filter is
used to obtain the blurred angle of the image, and the image is rotated by the obtained
angle information to change the blur direction of the image to the horizontal direction.
Then, the Fourier coefficients of the horizontally blurred image in the spectrum
domain are used as input to train the neural network to estimate its fuzzy length, as
shown in Fig. 4.14 for the convergence curve of the neural network.
These data will be applied to the establishment and training of the neural network
to obtain the corresponding model, through which the fuzzy length can be predicted.
By comparing and analyzing the preset data and the predicted data, you can determine
the performance of the model and determine whether it can obtain accurate prediction
results.
4.2.4 De-Motion Blur Analysis
In this study, after obtaining the estimated blur kernel through the estimated blur
parameters, the Wiener filter is used to restore the blurred image. In order to verify
the effectiveness of the method in this paper, the experiment uses motion blur with