

2.8 Basic Electrode Kinetics
27
Galvanostatic
polarization
Potentiostatic polarization
Mixed activation and
diffusion control
Diffusion-limited
conditions
Well-defined hydrodynamic conditions
Stagnant solution
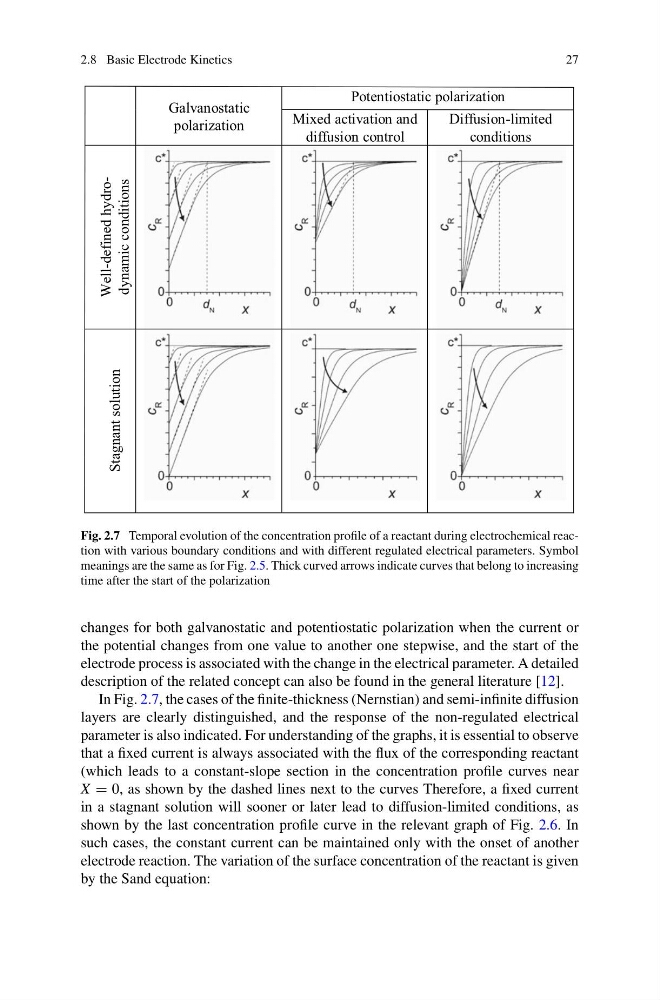
Fig. 2.7 Temporal evolution of the concentration profile of a reactant during electrochemical reaction with various boundary conditions and with different regulated electrical parameters. Symbol
meanings are the same as for Fig. 2.5. Thick curved arrows indicate curves that belong to increasing
time after the start of the polarization
changes for both galvanostatic and potentiostatic polarization when the current or
the potential changes from one value to another one stepwise, and the start of the
electrode process is associated with the change in the electrical parameter. A detailed
description of the related concept can also be found in the general literature [12].
In Fig. 2.7, the cases of the finite-thickness (Nernstian) and semi-infinite diffusion
layers are clearly distinguished, and the response of the non-regulated electrical
parameter is also indicated. For understanding of the graphs, it is essential to observe
that a fixed current is always associated with the flux of the corresponding reactant
(which leads to a constant-slope section in the concentration profile curves near
X = 0, as shown by the dashed lines next to the curves Therefore, a fixed current
in a stagnant solution will sooner or later lead to diffusion-limited conditions, as
shown by the last concentration profile curve in the relevant graph of Fig. 2.6. In
such cases, the constant current can be maintained only with the onset of another
electrode reaction. The variation of the surface concentration of the reactant is given
by the Sand equation:
27
Galvanostatic
polarization
Potentiostatic polarization
Mixed activation and
diffusion control
Diffusion-limited
conditions
Well-defined hydrodynamic conditions
Stagnant solution
Fig. 2.7 Temporal evolution of the concentration profile of a reactant during electrochemical reaction with various boundary conditions and with different regulated electrical parameters. Symbol
meanings are the same as for Fig. 2.5. Thick curved arrows indicate curves that belong to increasing
time after the start of the polarization
changes for both galvanostatic and potentiostatic polarization when the current or
the potential changes from one value to another one stepwise, and the start of the
electrode process is associated with the change in the electrical parameter. A detailed
description of the related concept can also be found in the general literature [12].
In Fig. 2.7, the cases of the finite-thickness (Nernstian) and semi-infinite diffusion
layers are clearly distinguished, and the response of the non-regulated electrical
parameter is also indicated. For understanding of the graphs, it is essential to observe
that a fixed current is always associated with the flux of the corresponding reactant
(which leads to a constant-slope section in the concentration profile curves near
X = 0, as shown by the dashed lines next to the curves Therefore, a fixed current
in a stagnant solution will sooner or later lead to diffusion-limited conditions, as
shown by the last concentration profile curve in the relevant graph of Fig. 2.6. In
such cases, the constant current can be maintained only with the onset of another
electrode reaction. The variation of the surface concentration of the reactant is given
by the Sand equation: