

26
2 Electrochemistry and Electrodeposition
dominates the denominator, the current density is reduced to j L . The shape of the
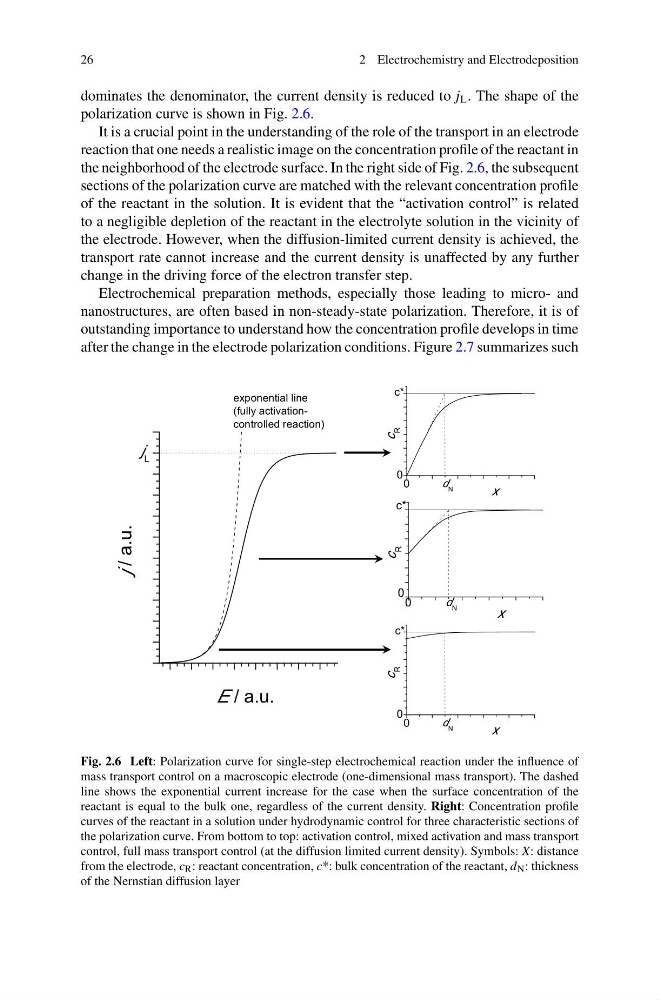
polarization curve is shown in Fig. 2.6.
It is a crucial point in the understanding of the role of the transport in an electrode
reaction that one needs a realistic image on the concentration profile of the reactant in
the neighborhood of the electrode surface. In the right side of Fig. 2.6, the subsequent
sections of the polarization curve are matched with the relevant concentration profile
of the reactant in the solution. It is evident that the “activation control” is related
to a negligible depletion of the reactant in the electrolyte solution in the vicinity of
the electrode. However, when the diffusion-limited current density is achieved, the
transport rate cannot increase and the current density is unaffected by any further
change in the driving force of the electron transfer step.
Electrochemical preparation methods, especially those leading to micro- and
nanostructures, are often based in non-steady-state polarization. Therefore, it is of
outstanding importance to understand how the concentration profile develops in time
after the change in the electrode polarization conditions. Figure 2.7 summarizes such
j / a.u.
E / a.u.
j L
exponential line
(fully activationcontrolled reaction)
c*
d N
0
0
c
R
x
c*
d N
0
0
c
R
x
c*
d N
0
0
c
R
x
Fig. 2.6 Left: Polarization curve for single-step electrochemical reaction under the influence of
mass transport control on a macroscopic electrode (one-dimensional mass transport). The dashed
line shows the exponential current increase for the case when the surface concentration of the
reactant is equal to the bulk one, regardless of the current density. Right: Concentration profile
curves of the reactant in a solution under hydrodynamic control for three characteristic sections of
the polarization curve. From bottom to top: activation control, mixed activation and mass transport
control, full mass transport control (at the diffusion limited current density). Symbols: X: distance
from the electrode, c R : reactant concentration, c*: bulk concentration of the reactant, d N : thickness
of the Nernstian diffusion layer
2 Electrochemistry and Electrodeposition
dominates the denominator, the current density is reduced to j L . The shape of the
polarization curve is shown in Fig. 2.6.
It is a crucial point in the understanding of the role of the transport in an electrode
reaction that one needs a realistic image on the concentration profile of the reactant in
the neighborhood of the electrode surface. In the right side of Fig. 2.6, the subsequent
sections of the polarization curve are matched with the relevant concentration profile
of the reactant in the solution. It is evident that the “activation control” is related
to a negligible depletion of the reactant in the electrolyte solution in the vicinity of
the electrode. However, when the diffusion-limited current density is achieved, the
transport rate cannot increase and the current density is unaffected by any further
change in the driving force of the electron transfer step.
Electrochemical preparation methods, especially those leading to micro- and
nanostructures, are often based in non-steady-state polarization. Therefore, it is of
outstanding importance to understand how the concentration profile develops in time
after the change in the electrode polarization conditions. Figure 2.7 summarizes such
j / a.u.
E / a.u.
j L
exponential line
(fully activationcontrolled reaction)
c*
d N
0
0
c
R
x
c*
d N
0
0
c
R
x
c*
d N
0
0
c
R
x
Fig. 2.6 Left: Polarization curve for single-step electrochemical reaction under the influence of
mass transport control on a macroscopic electrode (one-dimensional mass transport). The dashed
line shows the exponential current increase for the case when the surface concentration of the
reactant is equal to the bulk one, regardless of the current density. Right: Concentration profile
curves of the reactant in a solution under hydrodynamic control for three characteristic sections of
the polarization curve. From bottom to top: activation control, mixed activation and mass transport
control, full mass transport control (at the diffusion limited current density). Symbols: X: distance
from the electrode, c R : reactant concentration, c*: bulk concentration of the reactant, d N : thickness
of the Nernstian diffusion layer