

116
4 Ultrathin Layers
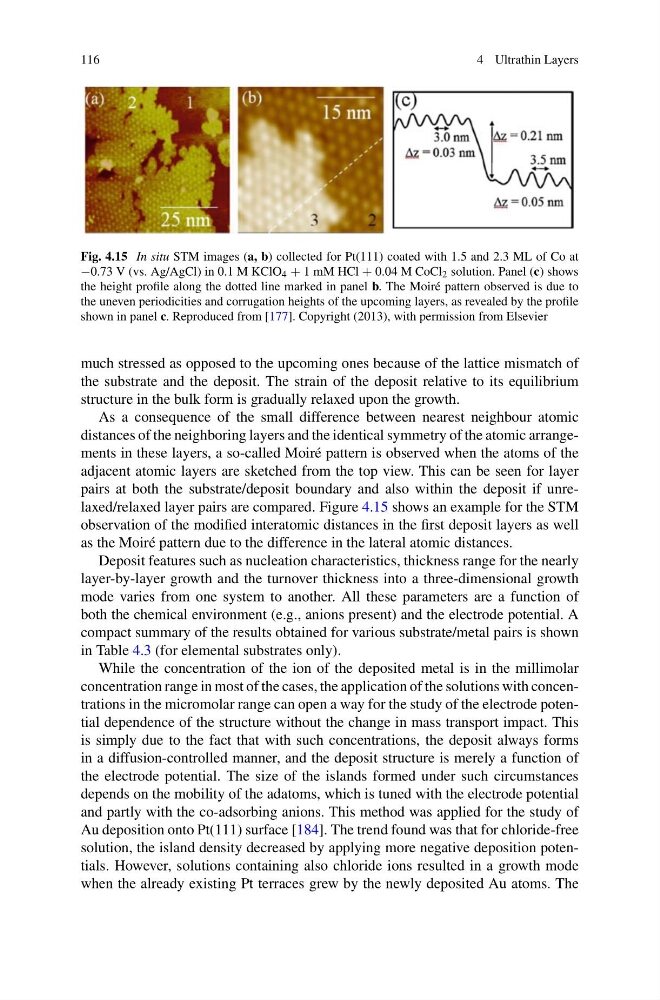
Fig. 4.15 In situ STM images (a, b) collected for Pt(111) coated with 1.5 and 2.3 ML of Co at
−0.73 V (vs. Ag/AgCl) in 0.1 M KClO 4 + 1 mM HCl + 0.04 M CoCl 2 solution. Panel (c) shows
the height profile along the dotted line marked in panel b. The Moiré pattern observed is due to
the uneven periodicities and corrugation heights of the upcoming layers, as revealed by the profile
shown in panel c. Reproduced from [177]. Copyright (2013), with permission from Elsevier
much stressed as opposed to the upcoming ones because of the lattice mismatch of
the substrate and the deposit. The strain of the deposit relative to its equilibrium
structure in the bulk form is gradually relaxed upon the growth.
As a consequence of the small difference between nearest neighbour atomic
distances of the neighboring layers and the identical symmetry of the atomic arrangements in these layers, a so-called Moiré pattern is observed when the atoms of the
adjacent atomic layers are sketched from the top view. This can be seen for layer
pairs at both the substrate/deposit boundary and also within the deposit if unrelaxed/relaxed layer pairs are compared. Figure 4.15 shows an example for the STM
observation of the modified interatomic distances in the first deposit layers as well
as the Moiré pattern due to the difference in the lateral atomic distances.
Deposit features such as nucleation characteristics, thickness range for the nearly
layer-by-layer growth and the turnover thickness into a three-dimensional growth
mode varies from one system to another. All these parameters are a function of
both the chemical environment (e.g., anions present) and the electrode potential. A
compact summary of the results obtained for various substrate/metal pairs is shown
in Table 4.3 (for elemental substrates only).
While the concentration of the ion of the deposited metal is in the millimolar
concentration range in most of the cases, the application of the solutions with concentrations in the micromolar range can open a way for the study of the electrode potential dependence of the structure without the change in mass transport impact. This
is simply due to the fact that with such concentrations, the deposit always forms
in a diffusion-controlled manner, and the deposit structure is merely a function of
the electrode potential. The size of the islands formed under such circumstances
depends on the mobility of the adatoms, which is tuned with the electrode potential
and partly with the co-adsorbing anions. This method was applied for the study of
Au deposition onto Pt(111) surface [184]. The trend found was that for chloride-free
solution, the island density decreased by applying more negative deposition potentials. However, solutions containing also chloride ions resulted in a growth mode
when the already existing Pt terraces grew by the newly deposited Au atoms. The
4 Ultrathin Layers
Fig. 4.15 In situ STM images (a, b) collected for Pt(111) coated with 1.5 and 2.3 ML of Co at
−0.73 V (vs. Ag/AgCl) in 0.1 M KClO 4 + 1 mM HCl + 0.04 M CoCl 2 solution. Panel (c) shows
the height profile along the dotted line marked in panel b. The Moiré pattern observed is due to
the uneven periodicities and corrugation heights of the upcoming layers, as revealed by the profile
shown in panel c. Reproduced from [177]. Copyright (2013), with permission from Elsevier
much stressed as opposed to the upcoming ones because of the lattice mismatch of
the substrate and the deposit. The strain of the deposit relative to its equilibrium
structure in the bulk form is gradually relaxed upon the growth.
As a consequence of the small difference between nearest neighbour atomic
distances of the neighboring layers and the identical symmetry of the atomic arrangements in these layers, a so-called Moiré pattern is observed when the atoms of the
adjacent atomic layers are sketched from the top view. This can be seen for layer
pairs at both the substrate/deposit boundary and also within the deposit if unrelaxed/relaxed layer pairs are compared. Figure 4.15 shows an example for the STM
observation of the modified interatomic distances in the first deposit layers as well
as the Moiré pattern due to the difference in the lateral atomic distances.
Deposit features such as nucleation characteristics, thickness range for the nearly
layer-by-layer growth and the turnover thickness into a three-dimensional growth
mode varies from one system to another. All these parameters are a function of
both the chemical environment (e.g., anions present) and the electrode potential. A
compact summary of the results obtained for various substrate/metal pairs is shown
in Table 4.3 (for elemental substrates only).
While the concentration of the ion of the deposited metal is in the millimolar
concentration range in most of the cases, the application of the solutions with concentrations in the micromolar range can open a way for the study of the electrode potential dependence of the structure without the change in mass transport impact. This
is simply due to the fact that with such concentrations, the deposit always forms
in a diffusion-controlled manner, and the deposit structure is merely a function of
the electrode potential. The size of the islands formed under such circumstances
depends on the mobility of the adatoms, which is tuned with the electrode potential
and partly with the co-adsorbing anions. This method was applied for the study of
Au deposition onto Pt(111) surface [184]. The trend found was that for chloride-free
solution, the island density decreased by applying more negative deposition potentials. However, solutions containing also chloride ions resulted in a growth mode
when the already existing Pt terraces grew by the newly deposited Au atoms. The