

Acoustic and Vibration Response Analysis of Heavy-Duty Gearbox
447
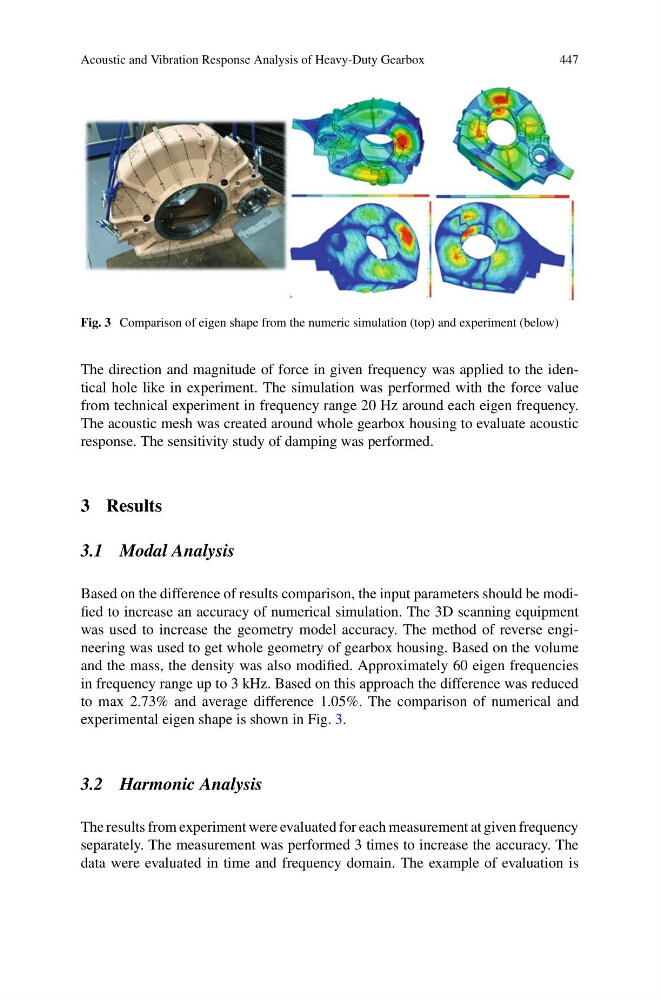
Fig. 3 Comparison of eigen shape from the numeric simulation (top) and experiment (below)
The direction and magnitude of force in given frequency was applied to the identical hole like in experiment. The simulation was performed with the force value
from technical experiment in frequency range 20 Hz around each eigen frequency.
The acoustic mesh was created around whole gearbox housing to evaluate acoustic
response. The sensitivity study of damping was performed.
3 Results
3.1 Modal Analysis
Based on the difference of results comparison, the input parameters should be modified to increase an accuracy of numerical simulation. The 3D scanning equipment
was used to increase the geometry model accuracy. The method of reverse engineering was used to get whole geometry of gearbox housing. Based on the volume
and the mass, the density was also modified. Approximately 60 eigen frequencies
in frequency range up to 3 kHz. Based on this approach the difference was reduced
to max 2.73% and average difference 1.05%. The comparison of numerical and
experimental eigen shape is shown in Fig. 3.
3.2 Harmonic Analysis
The results from experiment were evaluated for each measurement at given frequency
separately. The measurement was performed 3 times to increase the accuracy. The
data were evaluated in time and frequency domain. The example of evaluation is
447
Fig. 3 Comparison of eigen shape from the numeric simulation (top) and experiment (below)
The direction and magnitude of force in given frequency was applied to the identical hole like in experiment. The simulation was performed with the force value
from technical experiment in frequency range 20 Hz around each eigen frequency.
The acoustic mesh was created around whole gearbox housing to evaluate acoustic
response. The sensitivity study of damping was performed.
3 Results
3.1 Modal Analysis
Based on the difference of results comparison, the input parameters should be modified to increase an accuracy of numerical simulation. The 3D scanning equipment
was used to increase the geometry model accuracy. The method of reverse engineering was used to get whole geometry of gearbox housing. Based on the volume
and the mass, the density was also modified. Approximately 60 eigen frequencies
in frequency range up to 3 kHz. Based on this approach the difference was reduced
to max 2.73% and average difference 1.05%. The comparison of numerical and
experimental eigen shape is shown in Fig. 3.
3.2 Harmonic Analysis
The results from experiment were evaluated for each measurement at given frequency
separately. The measurement was performed 3 times to increase the accuracy. The
data were evaluated in time and frequency domain. The example of evaluation is