

446
K. Rehak et al.
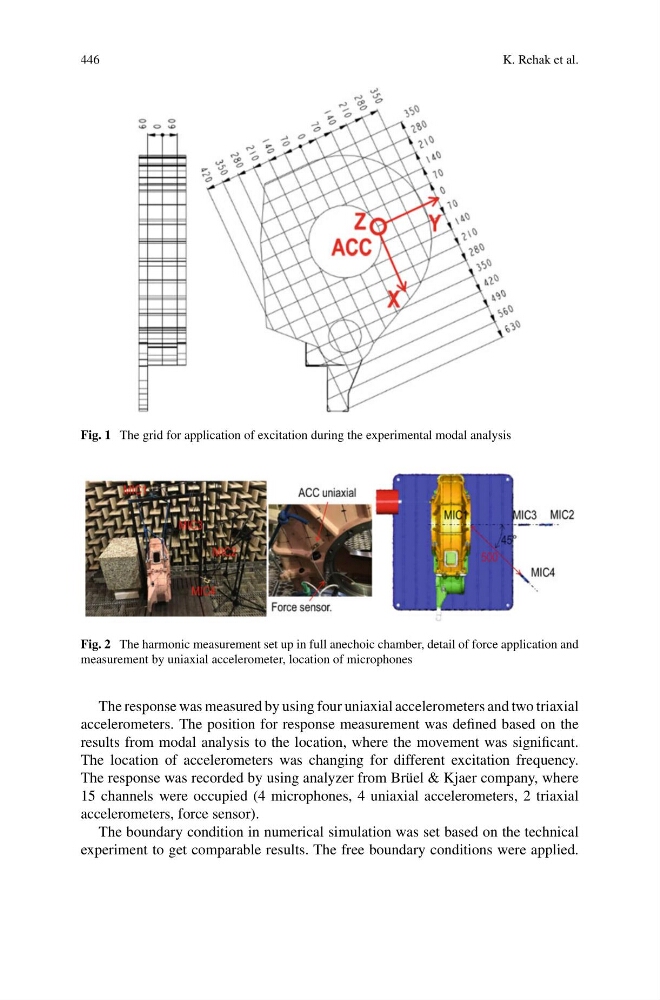
Fig. 1 The grid for application of excitation during the experimental modal analysis
Fig. 2 The harmonic measurement set up in full anechoic chamber, detail of force application and
measurement by uniaxial accelerometer, location of microphones
The response was measured by using four uniaxial accelerometers and two triaxial
accelerometers. The position for response measurement was defined based on the
results from modal analysis to the location, where the movement was significant.
The location of accelerometers was changing for different excitation frequency.
The response was recorded by using analyzer from Brüel & Kjaer company, where
15 channels were occupied (4 microphones, 4 uniaxial accelerometers, 2 triaxial
accelerometers, force sensor).
The boundary condition in numerical simulation was set based on the technical
experiment to get comparable results. The free boundary conditions were applied.
K. Rehak et al.
Fig. 1 The grid for application of excitation during the experimental modal analysis
Fig. 2 The harmonic measurement set up in full anechoic chamber, detail of force application and
measurement by uniaxial accelerometer, location of microphones
The response was measured by using four uniaxial accelerometers and two triaxial
accelerometers. The position for response measurement was defined based on the
results from modal analysis to the location, where the movement was significant.
The location of accelerometers was changing for different excitation frequency.
The response was recorded by using analyzer from Brüel & Kjaer company, where
15 channels were occupied (4 microphones, 4 uniaxial accelerometers, 2 triaxial
accelerometers, force sensor).
The boundary condition in numerical simulation was set based on the technical
experiment to get comparable results. The free boundary conditions were applied.