

438
V. Otipka et al.
but the values of surface normal velocity are lower compared to the aforementioned
side walls of the housing.
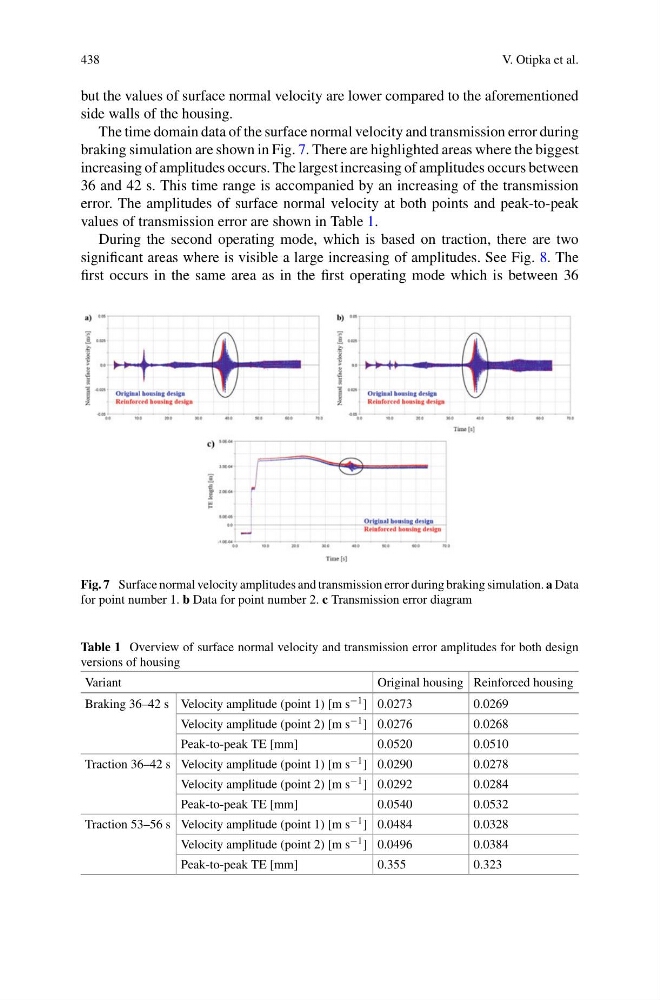
The time domain data of the surface normal velocity and transmission error during
braking simulation are shown in Fig. 7. There are highlighted areas where the biggest
increasing of amplitudes occurs. The largest increasing of amplitudes occurs between
36 and 42 s. This time range is accompanied by an increasing of the transmission
error. The amplitudes of surface normal velocity at both points and peak-to-peak
values of transmission error are shown in Table 1.
During the second operating mode, which is based on traction, there are two
significant areas where is visible a large increasing of amplitudes. See Fig. 8. The
first occurs in the same area as in the first operating mode which is between 36
Fig. 7 Surface normal velocity amplitudes and transmission error during braking simulation. a Data
for point number 1. b Data for point number 2. c Transmission error diagram
Table 1 Overview of surface normal velocity and transmission error amplitudes for both design
versions of housing
Variant
Original housing Reinforced housing
Braking 36–42 s Velocity amplitude (point 1) [m s −1 ] 0.0273
0.0269
Velocity amplitude (point 2) [m s −1 ] 0.0276
0.0268
Peak-to-peak TE [mm]
0.0520
0.0510
Traction 36–42 s Velocity amplitude (point 1) [m s −1 ] 0.0290
0.0278
Velocity amplitude (point 2) [m s −1 ] 0.0292
0.0284
Peak-to-peak TE [mm]
0.0540
0.0532
Traction 53–56 s Velocity amplitude (point 1) [m s −1 ] 0.0484
0.0328
Velocity amplitude (point 2) [m s −1 ] 0.0496
0.0384
Peak-to-peak TE [mm]
0.355
0.323
V. Otipka et al.
but the values of surface normal velocity are lower compared to the aforementioned
side walls of the housing.
The time domain data of the surface normal velocity and transmission error during
braking simulation are shown in Fig. 7. There are highlighted areas where the biggest
increasing of amplitudes occurs. The largest increasing of amplitudes occurs between
36 and 42 s. This time range is accompanied by an increasing of the transmission
error. The amplitudes of surface normal velocity at both points and peak-to-peak
values of transmission error are shown in Table 1.
During the second operating mode, which is based on traction, there are two
significant areas where is visible a large increasing of amplitudes. See Fig. 8. The
first occurs in the same area as in the first operating mode which is between 36
Fig. 7 Surface normal velocity amplitudes and transmission error during braking simulation. a Data
for point number 1. b Data for point number 2. c Transmission error diagram
Table 1 Overview of surface normal velocity and transmission error amplitudes for both design
versions of housing
Variant
Original housing Reinforced housing
Braking 36–42 s Velocity amplitude (point 1) [m s −1 ] 0.0273
0.0269
Velocity amplitude (point 2) [m s −1 ] 0.0276
0.0268
Peak-to-peak TE [mm]
0.0520
0.0510
Traction 36–42 s Velocity amplitude (point 1) [m s −1 ] 0.0290
0.0278
Velocity amplitude (point 2) [m s −1 ] 0.0292
0.0284
Peak-to-peak TE [mm]
0.0540
0.0532
Traction 53–56 s Velocity amplitude (point 1) [m s −1 ] 0.0484
0.0328
Velocity amplitude (point 2) [m s −1 ] 0.0496
0.0384
Peak-to-peak TE [mm]
0.355
0.323