

Numerical Dynamic Analysis of Gearbox Behaviour
437
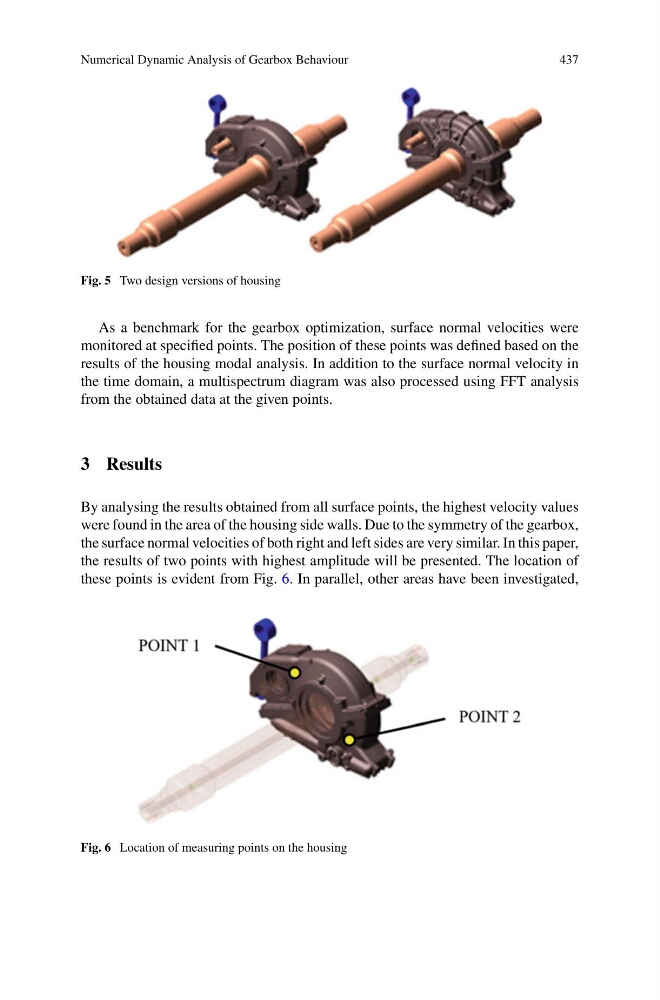
Fig. 5 Two design versions of housing
As a benchmark for the gearbox optimization, surface normal velocities were
monitored at specified points. The position of these points was defined based on the
results of the housing modal analysis. In addition to the surface normal velocity in
the time domain, a multispectrum diagram was also processed using FFT analysis
from the obtained data at the given points.
3 Results
By analysing the results obtained from all surface points, the highest velocity values
were found in the area of the housing side walls. Due to the symmetry of the gearbox,
the surface normal velocities of both right and left sides are very similar. In this paper,
the results of two points with highest amplitude will be presented. The location of
these points is evident from Fig. 6. In parallel, other areas have been investigated,
Fig. 6 Location of measuring points on the housing
437
Fig. 5 Two design versions of housing
As a benchmark for the gearbox optimization, surface normal velocities were
monitored at specified points. The position of these points was defined based on the
results of the housing modal analysis. In addition to the surface normal velocity in
the time domain, a multispectrum diagram was also processed using FFT analysis
from the obtained data at the given points.
3 Results
By analysing the results obtained from all surface points, the highest velocity values
were found in the area of the housing side walls. Due to the symmetry of the gearbox,
the surface normal velocities of both right and left sides are very similar. In this paper,
the results of two points with highest amplitude will be presented. The location of
these points is evident from Fig. 6. In parallel, other areas have been investigated,
Fig. 6 Location of measuring points on the housing