

436
V. Otipka et al.
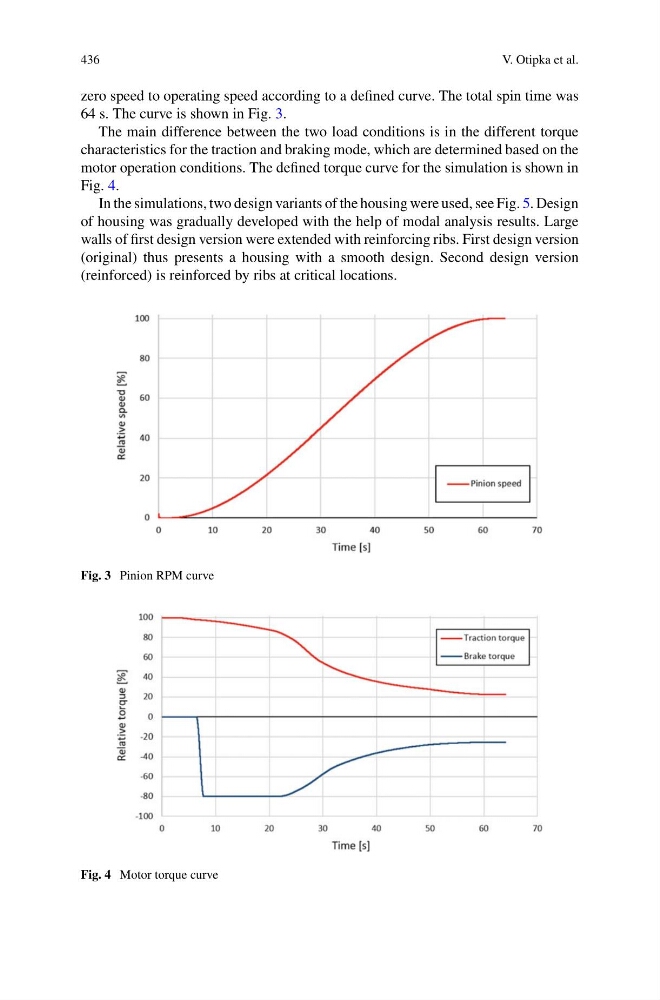
zero speed to operating speed according to a defined curve. The total spin time was
64 s. The curve is shown in Fig. 3.
The main difference between the two load conditions is in the different torque
characteristics for the traction and braking mode, which are determined based on the
motor operation conditions. The defined torque curve for the simulation is shown in
Fig. 4.
In the simulations, two design variants of the housing were used, see Fig. 5. Design
of housing was gradually developed with the help of modal analysis results. Large
walls of first design version were extended with reinforcing ribs. First design version
(original) thus presents a housing with a smooth design. Second design version
(reinforced) is reinforced by ribs at critical locations.
Fig. 3 Pinion RPM curve
Fig. 4 Motor torque curve
V. Otipka et al.
zero speed to operating speed according to a defined curve. The total spin time was
64 s. The curve is shown in Fig. 3.
The main difference between the two load conditions is in the different torque
characteristics for the traction and braking mode, which are determined based on the
motor operation conditions. The defined torque curve for the simulation is shown in
Fig. 4.
In the simulations, two design variants of the housing were used, see Fig. 5. Design
of housing was gradually developed with the help of modal analysis results. Large
walls of first design version were extended with reinforcing ribs. First design version
(original) thus presents a housing with a smooth design. Second design version
(reinforced) is reinforced by ribs at critical locations.
Fig. 3 Pinion RPM curve
Fig. 4 Motor torque curve