

Numerical Dynamic Analysis of Gearbox Behaviour
439
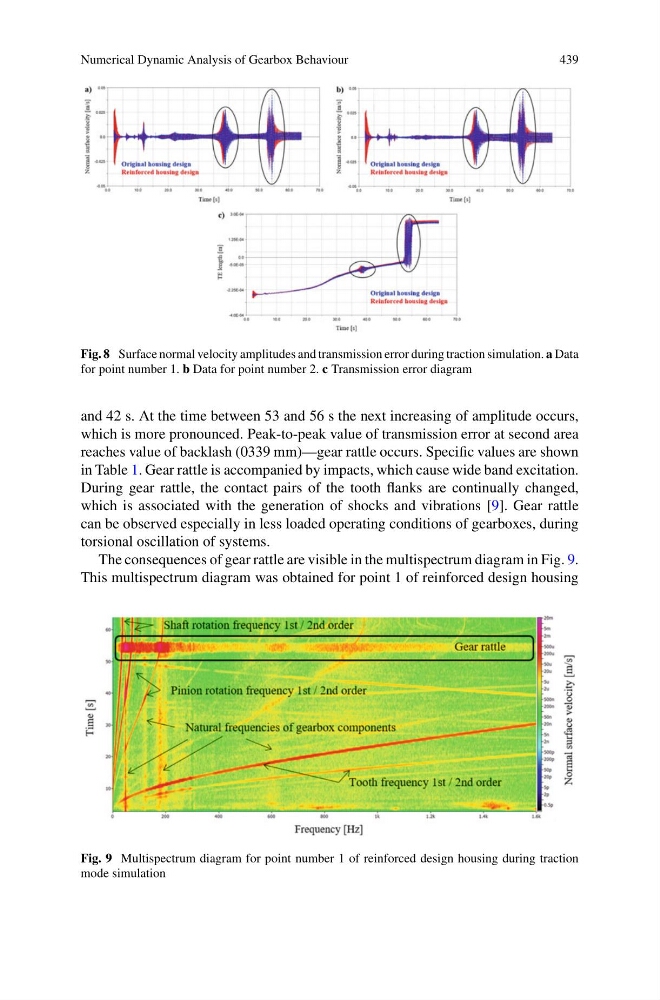
Fig. 8 Surface normal velocity amplitudes and transmission error during traction simulation. a Data
for point number 1. b Data for point number 2. c Transmission error diagram
and 42 s. At the time between 53 and 56 s the next increasing of amplitude occurs,
which is more pronounced. Peak-to-peak value of transmission error at second area
reaches value of backlash (0339 mm)—gear rattle occurs. Specific values are shown
in Table 1. Gear rattle is accompanied by impacts, which cause wide band excitation.
During gear rattle, the contact pairs of the tooth flanks are continually changed,
which is associated with the generation of shocks and vibrations [9]. Gear rattle
can be observed especially in less loaded operating conditions of gearboxes, during
torsional oscillation of systems.
The consequences of gear rattle are visible in the multispectrum diagram in Fig. 9.
This multispectrum diagram was obtained for point 1 of reinforced design housing
Fig. 9 Multispectrum diagram for point number 1 of reinforced design housing during traction
mode simulation
439
Fig. 8 Surface normal velocity amplitudes and transmission error during traction simulation. a Data
for point number 1. b Data for point number 2. c Transmission error diagram
and 42 s. At the time between 53 and 56 s the next increasing of amplitude occurs,
which is more pronounced. Peak-to-peak value of transmission error at second area
reaches value of backlash (0339 mm)—gear rattle occurs. Specific values are shown
in Table 1. Gear rattle is accompanied by impacts, which cause wide band excitation.
During gear rattle, the contact pairs of the tooth flanks are continually changed,
which is associated with the generation of shocks and vibrations [9]. Gear rattle
can be observed especially in less loaded operating conditions of gearboxes, during
torsional oscillation of systems.
The consequences of gear rattle are visible in the multispectrum diagram in Fig. 9.
This multispectrum diagram was obtained for point 1 of reinforced design housing
Fig. 9 Multispectrum diagram for point number 1 of reinforced design housing during traction
mode simulation