

336
M. Rasinac et al.
1.1)
1.2)
1.3)
1.4)
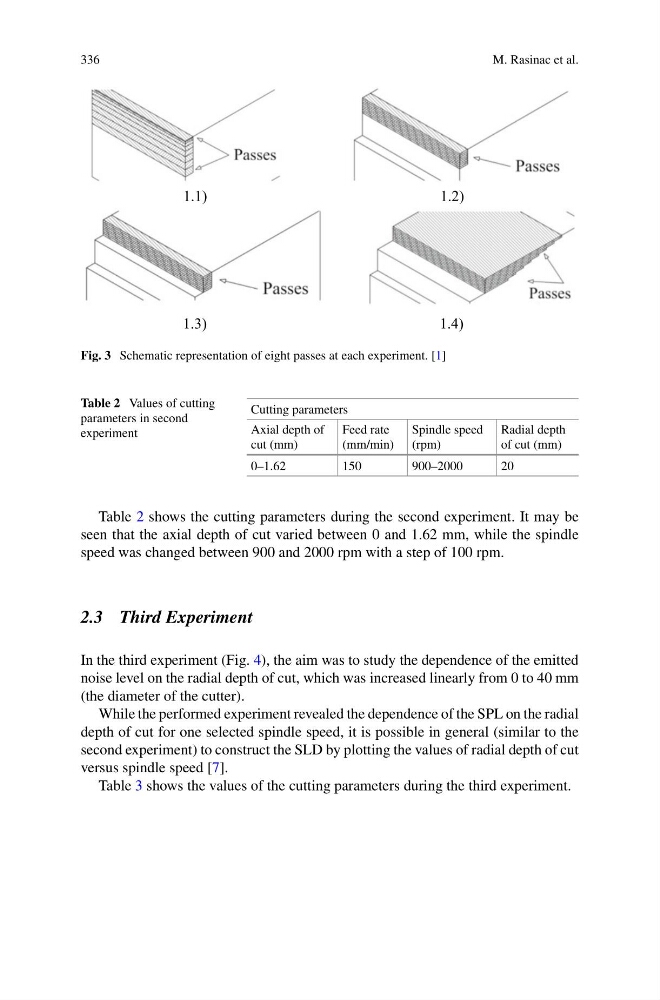
Fig. 3 Schematic representation of eight passes at each experiment. [1]
Table 2 Values of cutting
parameters in second
experiment
Cutting parameters
Axial depth of
cut (mm)
Feed rate
(mm/min)
Spindle speed
(rpm)
Radial depth
of cut (mm)
0–1.62
150
900–2000
20
Table 2 shows the cutting parameters during the second experiment. It may be
seen that the axial depth of cut varied between 0 and 1.62 mm, while the spindle
speed was changed between 900 and 2000 rpm with a step of 100 rpm.
2.3 Third Experiment
In the third experiment (Fig. 4), the aim was to study the dependence of the emitted
noise level on the radial depth of cut, which was increased linearly from 0 to 40 mm
(the diameter of the cutter).
While the performed experiment revealed the dependence of the SPL on the radial
depth of cut for one selected spindle speed, it is possible in general (similar to the
second experiment) to construct the SLD by plotting the values of radial depth of cut
versus spindle speed [7].
Table 3 shows the values of the cutting parameters during the third experiment.
M. Rasinac et al.
1.1)
1.2)
1.3)
1.4)
Fig. 3 Schematic representation of eight passes at each experiment. [1]
Table 2 Values of cutting
parameters in second
experiment
Cutting parameters
Axial depth of
cut (mm)
Feed rate
(mm/min)
Spindle speed
(rpm)
Radial depth
of cut (mm)
0–1.62
150
900–2000
20
Table 2 shows the cutting parameters during the second experiment. It may be
seen that the axial depth of cut varied between 0 and 1.62 mm, while the spindle
speed was changed between 900 and 2000 rpm with a step of 100 rpm.
2.3 Third Experiment
In the third experiment (Fig. 4), the aim was to study the dependence of the emitted
noise level on the radial depth of cut, which was increased linearly from 0 to 40 mm
(the diameter of the cutter).
While the performed experiment revealed the dependence of the SPL on the radial
depth of cut for one selected spindle speed, it is possible in general (similar to the
second experiment) to construct the SLD by plotting the values of radial depth of cut
versus spindle speed [7].
Table 3 shows the values of the cutting parameters during the third experiment.