

Experimental Analysis of Noise and Chatter Detection in Milling …
335
Table 1 Values of cutting parameters in first set of experiments
Cutting parameters
Experiment no.
Axial depth (mm)
Feed rate
(mm/min)
Spindle speed
(rpm)
Radial depth
(mm)
1.1
0.5–3
150
800
5
1.2
1
375–900
1000
5
1.3
1
300
600–1300
5
1.4
1
150
1000
5–40
2.2 The Second Experiment
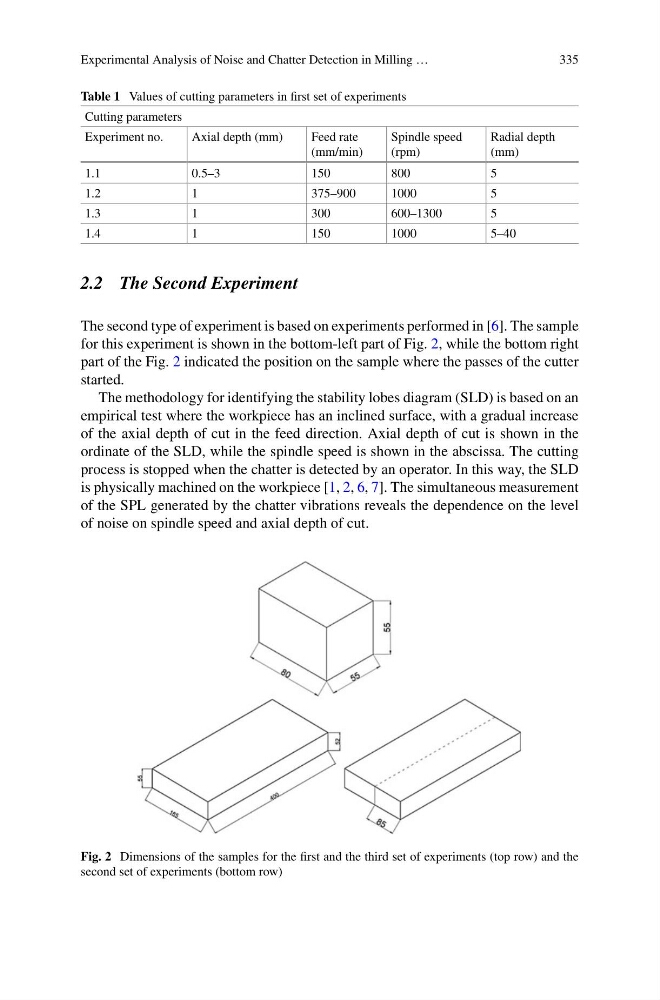
The second type of experiment is based on experiments performed in [6]. The sample
for this experiment is shown in the bottom-left part of Fig. 2, while the bottom right
part of the Fig. 2 indicated the position on the sample where the passes of the cutter
started.
The methodology for identifying the stability lobes diagram (SLD) is based on an
empirical test where the workpiece has an inclined surface, with a gradual increase
of the axial depth of cut in the feed direction. Axial depth of cut is shown in the
ordinate of the SLD, while the spindle speed is shown in the abscissa. The cutting
process is stopped when the chatter is detected by an operator. In this way, the SLD
is physically machined on the workpiece [1, 2, 6, 7]. The simultaneous measurement
of the SPL generated by the chatter vibrations reveals the dependence on the level
of noise on spindle speed and axial depth of cut.
Fig. 2 Dimensions of the samples for the first and the third set of experiments (top row) and the
second set of experiments (bottom row)
335
Table 1 Values of cutting parameters in first set of experiments
Cutting parameters
Experiment no.
Axial depth (mm)
Feed rate
(mm/min)
Spindle speed
(rpm)
Radial depth
(mm)
1.1
0.5–3
150
800
5
1.2
1
375–900
1000
5
1.3
1
300
600–1300
5
1.4
1
150
1000
5–40
2.2 The Second Experiment
The second type of experiment is based on experiments performed in [6]. The sample
for this experiment is shown in the bottom-left part of Fig. 2, while the bottom right
part of the Fig. 2 indicated the position on the sample where the passes of the cutter
started.
The methodology for identifying the stability lobes diagram (SLD) is based on an
empirical test where the workpiece has an inclined surface, with a gradual increase
of the axial depth of cut in the feed direction. Axial depth of cut is shown in the
ordinate of the SLD, while the spindle speed is shown in the abscissa. The cutting
process is stopped when the chatter is detected by an operator. In this way, the SLD
is physically machined on the workpiece [1, 2, 6, 7]. The simultaneous measurement
of the SPL generated by the chatter vibrations reveals the dependence on the level
of noise on spindle speed and axial depth of cut.
Fig. 2 Dimensions of the samples for the first and the third set of experiments (top row) and the
second set of experiments (bottom row)