

Biomechanical Evaluation of Medical Rehabilitation for a Patient …
263
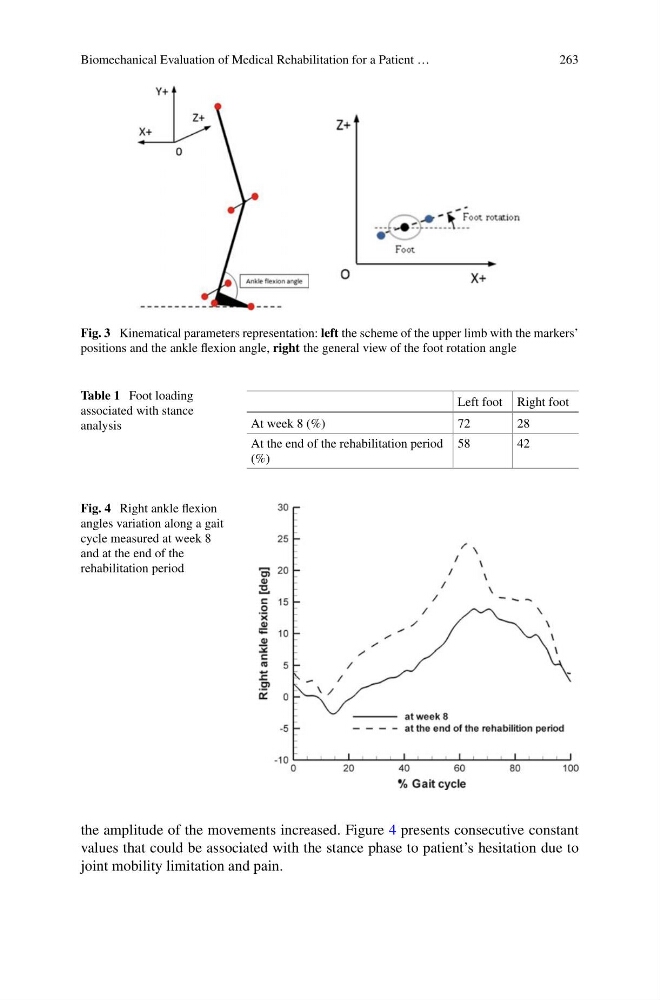
Fig. 3 Kinematical parameters representation: left the scheme of the upper limb with the markers’
positions and the ankle flexion angle, right the general view of the foot rotation angle
Table 1 Foot loading
associated with stance
analysis
Left foot Right foot
At week 8 (%)
72
28
At the end of the rehabilitation period
(%)
58
42
Fig. 4 Right ankle flexion
angles variation along a gait
cycle measured at week 8
and at the end of the
rehabilitation period
the amplitude of the movements increased. Figure 4 presents consecutive constant
values that could be associated with the stance phase to patient’s hesitation due to
joint mobility limitation and pain.
263
Fig. 3 Kinematical parameters representation: left the scheme of the upper limb with the markers’
positions and the ankle flexion angle, right the general view of the foot rotation angle
Table 1 Foot loading
associated with stance
analysis
Left foot Right foot
At week 8 (%)
72
28
At the end of the rehabilitation period
(%)
58
42
Fig. 4 Right ankle flexion
angles variation along a gait
cycle measured at week 8
and at the end of the
rehabilitation period
the amplitude of the movements increased. Figure 4 presents consecutive constant
values that could be associated with the stance phase to patient’s hesitation due to
joint mobility limitation and pain.