

262
M. Lupsa et al.
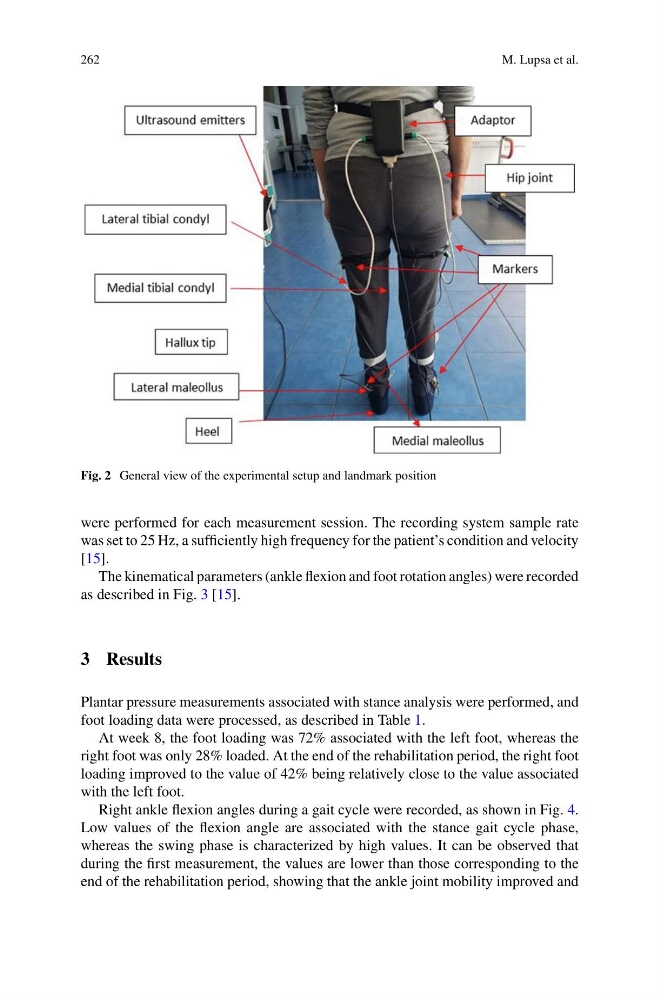
Fig. 2 General view of the experimental setup and landmark position
were performed for each measurement session. The recording system sample rate
was set to 25 Hz, a sufficiently high frequency for the patient’s condition and velocity
[15].
The kinematical parameters (ankle flexion and foot rotation angles) were recorded
as described in Fig. 3 [15].
3 Results
Plantar pressure measurements associated with stance analysis were performed, and
foot loading data were processed, as described in Table 1.
At week 8, the foot loading was 72% associated with the left foot, whereas the
right foot was only 28% loaded. At the end of the rehabilitation period, the right foot
loading improved to the value of 42% being relatively close to the value associated
with the left foot.
Right ankle flexion angles during a gait cycle were recorded, as shown in Fig. 4.
Low values of the flexion angle are associated with the stance gait cycle phase,
whereas the swing phase is characterized by high values. It can be observed that
during the first measurement, the values are lower than those corresponding to the
end of the rehabilitation period, showing that the ankle joint mobility improved and
M. Lupsa et al.
Fig. 2 General view of the experimental setup and landmark position
were performed for each measurement session. The recording system sample rate
was set to 25 Hz, a sufficiently high frequency for the patient’s condition and velocity
[15].
The kinematical parameters (ankle flexion and foot rotation angles) were recorded
as described in Fig. 3 [15].
3 Results
Plantar pressure measurements associated with stance analysis were performed, and
foot loading data were processed, as described in Table 1.
At week 8, the foot loading was 72% associated with the left foot, whereas the
right foot was only 28% loaded. At the end of the rehabilitation period, the right foot
loading improved to the value of 42% being relatively close to the value associated
with the left foot.
Right ankle flexion angles during a gait cycle were recorded, as shown in Fig. 4.
Low values of the flexion angle are associated with the stance gait cycle phase,
whereas the swing phase is characterized by high values. It can be observed that
during the first measurement, the values are lower than those corresponding to the
end of the rehabilitation period, showing that the ankle joint mobility improved and