

Numerical Investigation of an Idealized Overlapping Coronary …
255
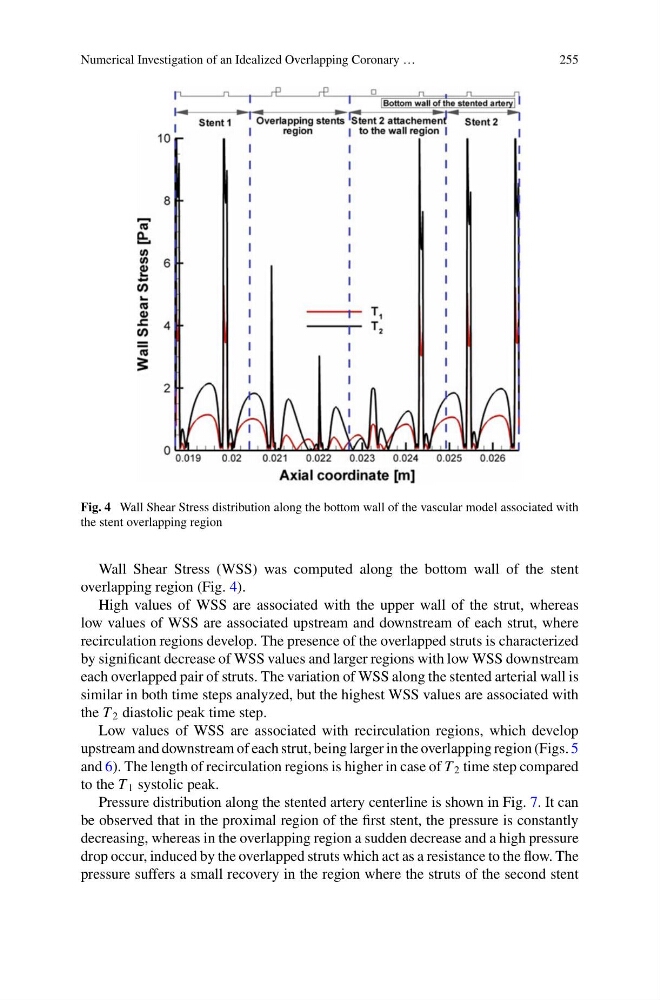
Fig. 4 Wall Shear Stress distribution along the bottom wall of the vascular model associated with
the stent overlapping region
Wall Shear Stress (WSS) was computed along the bottom wall of the stent
overlapping region (Fig. 4).
High values of WSS are associated with the upper wall of the strut, whereas
low values of WSS are associated upstream and downstream of each strut, where
recirculation regions develop. The presence of the overlapped struts is characterized
by significant decrease of WSS values and larger regions with low WSS downstream
each overlapped pair of struts. The variation of WSS along the stented arterial wall is
similar in both time steps analyzed, but the highest WSS values are associated with
the T 2 diastolic peak time step.
Low values of WSS are associated with recirculation regions, which develop
upstream and downstream of each strut, being larger in the overlapping region (Figs. 5
and 6). The length of recirculation regions is higher in case of T 2 time step compared
to the T 1 systolic peak.
Pressure distribution along the stented artery centerline is shown in Fig. 7. It can
be observed that in the proximal region of the first stent, the pressure is constantly
decreasing, whereas in the overlapping region a sudden decrease and a high pressure
drop occur, induced by the overlapped struts which act as a resistance to the flow. The
pressure suffers a small recovery in the region where the struts of the second stent
255
Fig. 4 Wall Shear Stress distribution along the bottom wall of the vascular model associated with
the stent overlapping region
Wall Shear Stress (WSS) was computed along the bottom wall of the stent
overlapping region (Fig. 4).
High values of WSS are associated with the upper wall of the strut, whereas
low values of WSS are associated upstream and downstream of each strut, where
recirculation regions develop. The presence of the overlapped struts is characterized
by significant decrease of WSS values and larger regions with low WSS downstream
each overlapped pair of struts. The variation of WSS along the stented arterial wall is
similar in both time steps analyzed, but the highest WSS values are associated with
the T 2 diastolic peak time step.
Low values of WSS are associated with recirculation regions, which develop
upstream and downstream of each strut, being larger in the overlapping region (Figs. 5
and 6). The length of recirculation regions is higher in case of T 2 time step compared
to the T 1 systolic peak.
Pressure distribution along the stented artery centerline is shown in Fig. 7. It can
be observed that in the proximal region of the first stent, the pressure is constantly
decreasing, whereas in the overlapping region a sudden decrease and a high pressure
drop occur, induced by the overlapped struts which act as a resistance to the flow. The
pressure suffers a small recovery in the region where the struts of the second stent