

256
A. Totorean et al.
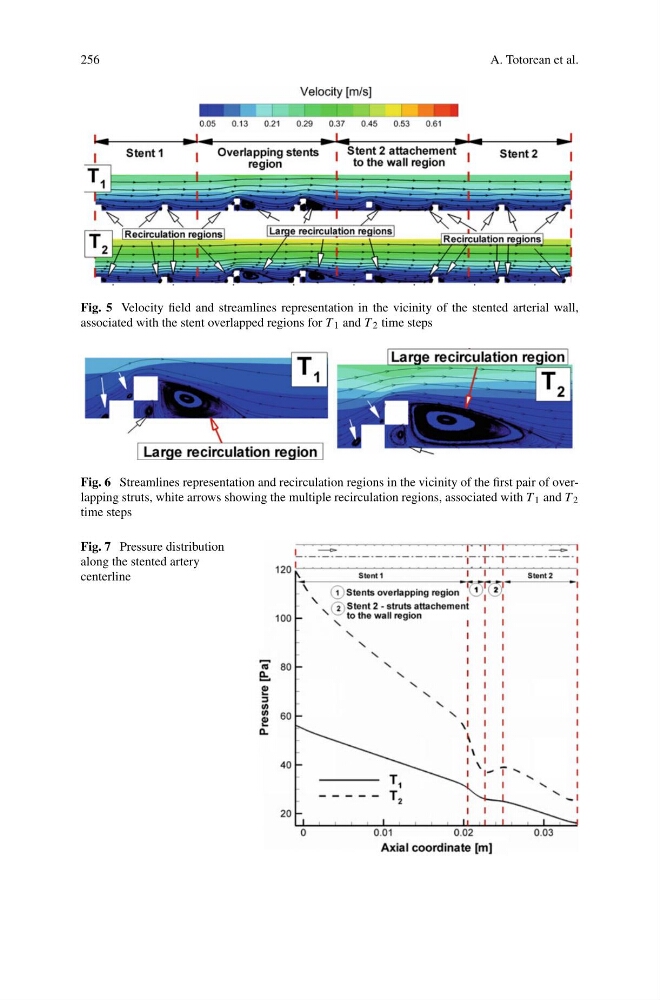
Fig. 5 Velocity field and streamlines representation in the vicinity of the stented arterial wall,
associated with the stent overlapped regions for T 1 and T 2 time steps
Fig. 6 Streamlines representation and recirculation regions in the vicinity of the first pair of overlapping struts, white arrows showing the multiple recirculation regions, associated with T 1 and T 2
time steps
Fig. 7 Pressure distribution
along the stented artery
centerline
A. Totorean et al.
Fig. 5 Velocity field and streamlines representation in the vicinity of the stented arterial wall,
associated with the stent overlapped regions for T 1 and T 2 time steps
Fig. 6 Streamlines representation and recirculation regions in the vicinity of the first pair of overlapping struts, white arrows showing the multiple recirculation regions, associated with T 1 and T 2
time steps
Fig. 7 Pressure distribution
along the stented artery
centerline