

152
M. Liˇ canin et al.
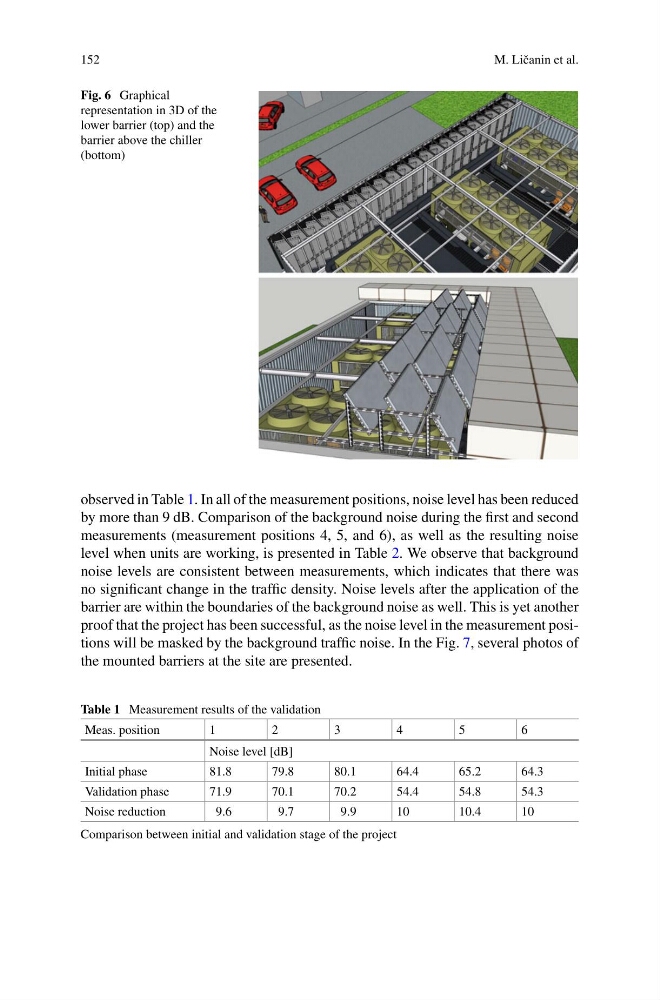
Fig. 6 Graphical
representation in 3D of the
lower barrier (top) and the
barrier above the chiller
(bottom)
observed in Table 1. In all of the measurement positions, noise level has been reduced
by more than 9 dB. Comparison of the background noise during the first and second
measurements (measurement positions 4, 5, and 6), as well as the resulting noise
level when units are working, is presented in Table 2. We observe that background
noise levels are consistent between measurements, which indicates that there was
no significant change in the traffic density. Noise levels after the application of the
barrier are within the boundaries of the background noise as well. This is yet another
proof that the project has been successful, as the noise level in the measurement positions will be masked by the background traffic noise. In the Fig. 7, several photos of
the mounted barriers at the site are presented.
Table 1 Measurement results of the validation
Meas. position
1
2
3
4
5
6
Noise level [dB]
Initial phase
81.8
79.8
80.1
64.4
65.2
64.3
Validation phase
71.9
70.1
70.2
54.4
54.8
54.3
Noise reduction
9.6
9.7
9.9
10
10.4
10
Comparison between initial and validation stage of the project
M. Liˇ canin et al.
Fig. 6 Graphical
representation in 3D of the
lower barrier (top) and the
barrier above the chiller
(bottom)
observed in Table 1. In all of the measurement positions, noise level has been reduced
by more than 9 dB. Comparison of the background noise during the first and second
measurements (measurement positions 4, 5, and 6), as well as the resulting noise
level when units are working, is presented in Table 2. We observe that background
noise levels are consistent between measurements, which indicates that there was
no significant change in the traffic density. Noise levels after the application of the
barrier are within the boundaries of the background noise as well. This is yet another
proof that the project has been successful, as the noise level in the measurement positions will be masked by the background traffic noise. In the Fig. 7, several photos of
the mounted barriers at the site are presented.
Table 1 Measurement results of the validation
Meas. position
1
2
3
4
5
6
Noise level [dB]
Initial phase
81.8
79.8
80.1
64.4
65.2
64.3
Validation phase
71.9
70.1
70.2
54.4
54.8
54.3
Noise reduction
9.6
9.7
9.9
10
10.4
10
Comparison between initial and validation stage of the project