

88
A. A. Minda et al.
This analysis shows that the maximizer achieved from simulation accurately
follow the pseudo-sinc function, so it can be used as a support for interpolation.
This finding is especially useful for damage detection processes, where accurate
frequency estimation is requested [10].
The second aspect of this paper is to determine the coefficients of an interpolation
curve for a given frequency that allows us to determine the coefficients for any
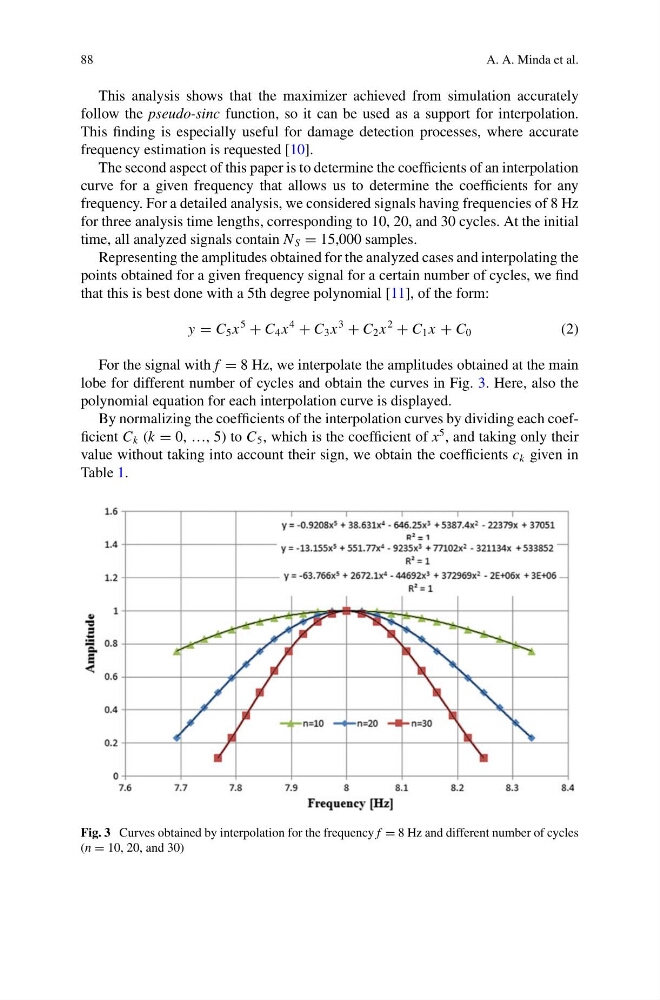
frequency. For a detailed analysis, we considered signals having frequencies of 8 Hz
for three analysis time lengths, corresponding to 10, 20, and 30 cycles. At the initial
time, all analyzed signals contain N S = 15,000 samples.
Representing the amplitudes obtained for the analyzed cases and interpolating the
points obtained for a given frequency signal for a certain number of cycles, we find
that this is best done with a 5th degree polynomial [11], of the form:
y = C 5 x
5
+ C 4 x
4
+ C 3 x
3
+ C 2 x
2
+ C 1 x + C 0
(2)
For the signal with f = 8 Hz, we interpolate the amplitudes obtained at the main
lobe for different number of cycles and obtain the curves in Fig. 3. Here, also the
polynomial equation for each interpolation curve is displayed.
By normalizing the coefficients of the interpolation curves by dividing each coefficient C k (k = 0, …, 5) to C 5 , which is the coefficient of x
5 , and taking only their
value without taking into account their sign, we obtain the coefficients c k given in
Table 1.
Fig. 3 Curves obtained by interpolation for the frequency f = 8 Hz and different number of cycles
(n = 10, 20, and 30)
A. A. Minda et al.
This analysis shows that the maximizer achieved from simulation accurately
follow the pseudo-sinc function, so it can be used as a support for interpolation.
This finding is especially useful for damage detection processes, where accurate
frequency estimation is requested [10].
The second aspect of this paper is to determine the coefficients of an interpolation
curve for a given frequency that allows us to determine the coefficients for any
frequency. For a detailed analysis, we considered signals having frequencies of 8 Hz
for three analysis time lengths, corresponding to 10, 20, and 30 cycles. At the initial
time, all analyzed signals contain N S = 15,000 samples.
Representing the amplitudes obtained for the analyzed cases and interpolating the
points obtained for a given frequency signal for a certain number of cycles, we find
that this is best done with a 5th degree polynomial [11], of the form:
y = C 5 x
5
+ C 4 x
4
+ C 3 x
3
+ C 2 x
2
+ C 1 x + C 0
(2)
For the signal with f = 8 Hz, we interpolate the amplitudes obtained at the main
lobe for different number of cycles and obtain the curves in Fig. 3. Here, also the
polynomial equation for each interpolation curve is displayed.
By normalizing the coefficients of the interpolation curves by dividing each coefficient C k (k = 0, …, 5) to C 5 , which is the coefficient of x
5 , and taking only their
value without taking into account their sign, we obtain the coefficients c k given in
Table 1.
Fig. 3 Curves obtained by interpolation for the frequency f = 8 Hz and different number of cycles
(n = 10, 20, and 30)