

Improving the Accuracy of Estimates of the Frequencies …
87
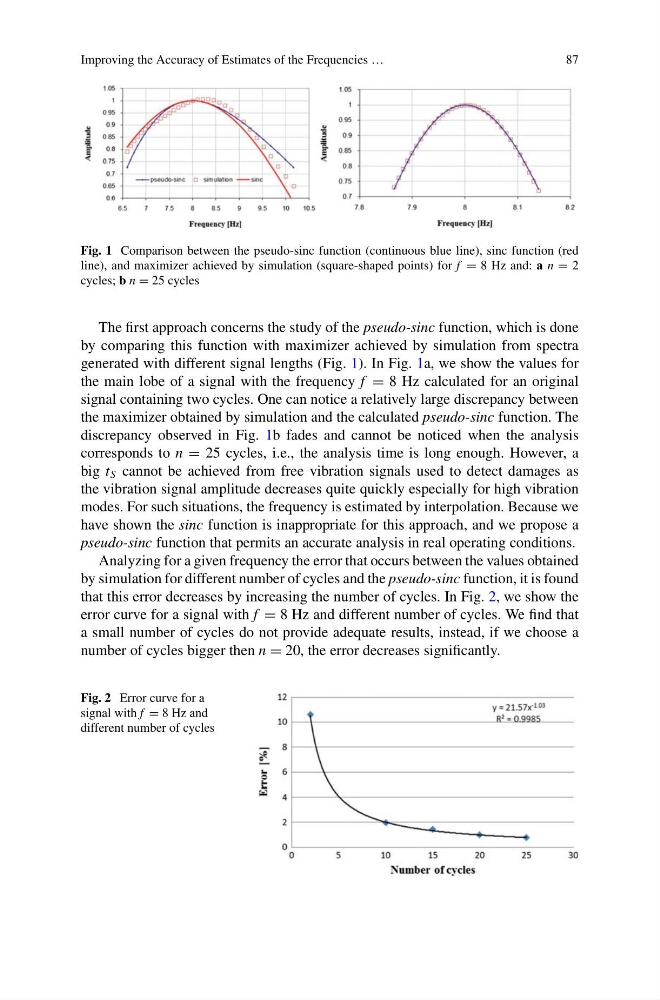
Fig. 1 Comparison between the pseudo-sinc function (continuous blue line), sinc function (red
line), and maximizer achieved by simulation (square-shaped points) for f = 8 Hz and: a n = 2
cycles; b n = 25 cycles
The first approach concerns the study of the pseudo-sinc function, which is done
by comparing this function with maximizer achieved by simulation from spectra
generated with different signal lengths (Fig. 1). In Fig. 1a, we show the values for
the main lobe of a signal with the frequency f = 8 Hz calculated for an original
signal containing two cycles. One can notice a relatively large discrepancy between
the maximizer obtained by simulation and the calculated pseudo-sinc function. The
discrepancy observed in Fig. 1b fades and cannot be noticed when the analysis
corresponds to n = 25 cycles, i.e., the analysis time is long enough. However, a
big t S cannot be achieved from free vibration signals used to detect damages as
the vibration signal amplitude decreases quite quickly especially for high vibration
modes. For such situations, the frequency is estimated by interpolation. Because we
have shown the sinc function is inappropriate for this approach, and we propose a
pseudo-sinc function that permits an accurate analysis in real operating conditions.
Analyzing for a given frequency the error that occurs between the values obtained
by simulation for different number of cycles and the pseudo-sinc function, it is found
that this error decreases by increasing the number of cycles. In Fig. 2, we show the
error curve for a signal with f = 8 Hz and different number of cycles. We find that
a small number of cycles do not provide adequate results, instead, if we choose a
number of cycles bigger then n = 20, the error decreases significantly.
Fig. 2 Error curve for a
signal with f = 8 Hz and
different number of cycles
87
Fig. 1 Comparison between the pseudo-sinc function (continuous blue line), sinc function (red
line), and maximizer achieved by simulation (square-shaped points) for f = 8 Hz and: a n = 2
cycles; b n = 25 cycles
The first approach concerns the study of the pseudo-sinc function, which is done
by comparing this function with maximizer achieved by simulation from spectra
generated with different signal lengths (Fig. 1). In Fig. 1a, we show the values for
the main lobe of a signal with the frequency f = 8 Hz calculated for an original
signal containing two cycles. One can notice a relatively large discrepancy between
the maximizer obtained by simulation and the calculated pseudo-sinc function. The
discrepancy observed in Fig. 1b fades and cannot be noticed when the analysis
corresponds to n = 25 cycles, i.e., the analysis time is long enough. However, a
big t S cannot be achieved from free vibration signals used to detect damages as
the vibration signal amplitude decreases quite quickly especially for high vibration
modes. For such situations, the frequency is estimated by interpolation. Because we
have shown the sinc function is inappropriate for this approach, and we propose a
pseudo-sinc function that permits an accurate analysis in real operating conditions.
Analyzing for a given frequency the error that occurs between the values obtained
by simulation for different number of cycles and the pseudo-sinc function, it is found
that this error decreases by increasing the number of cycles. In Fig. 2, we show the
error curve for a signal with f = 8 Hz and different number of cycles. We find that
a small number of cycles do not provide adequate results, instead, if we choose a
number of cycles bigger then n = 20, the error decreases significantly.
Fig. 2 Error curve for a
signal with f = 8 Hz and
different number of cycles