

86
A. A. Minda et al.
the made analysis, we can also see that the maximizer are distributed by a nonsymmetrical pseudo-sinc function with real frequency, justifying, at the same time,
the opportunity to use such functions in spectral analyzes.
2 Leakage Phenomena and the Frequency Estimation
of a Signal
It is considered a continuous harmonic signal with known angular frequency ω
and amplitude A. The discrete form of the continuous signal according to [9] is
{x} = {x[0], x[1], . . . , x[ j], . . . , x[N − 1]}. Each element of this sequence has a
real coefficient a j , an imaginary coefficient b j , and a modulus X j resulted from the
first two, which differ for different signal time lengths t S . After ignoring some terms
which are small if ω = 2π f is large enough, the modulus becomes:
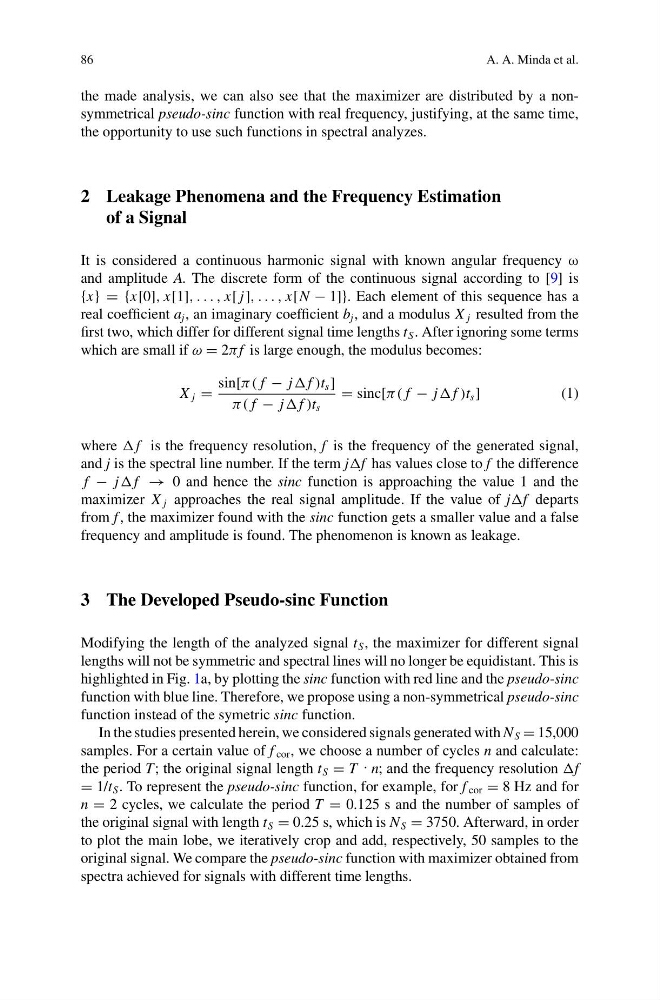
X j =
sin[π ( f − j f )t s ]
π ( f − j f )t s
= sinc[π ( f − j f )t s ]
(1)
where f is the frequency resolution, f is the frequency of the generated signal,
and j is the spectral line number. If the term jf has values close to f the difference
f − j f → 0 and hence the sinc function is approaching the value 1 and the
maximizer X j approaches the real signal amplitude. If the value of jf departs
from f , the maximizer found with the sinc function gets a smaller value and a false
frequency and amplitude is found. The phenomenon is known as leakage.
3 The Developed Pseudo-sinc Function
Modifying the length of the analyzed signal t S , the maximizer for different signal
lengths will not be symmetric and spectral lines will no longer be equidistant. This is
highlighted in Fig. 1a, by plotting the sinc function with red line and the pseudo-sinc
function with blue line. Therefore, we propose using a non-symmetrical pseudo-sinc
function instead of the symetric sinc function.
In the studies presented herein, we considered signals generated with N S = 15,000
samples. For a certain value of f cor , we choose a number of cycles n and calculate:
the period T; the original signal length t S = T : n; and the frequency resolution f
= 1/t S . To represent the pseudo-sinc function, for example, for f cor = 8 Hz and for
n = 2 cycles, we calculate the period T = 0.125 s and the number of samples of
the original signal with length t S = 0.25 s, which is N S = 3750. Afterward, in order
to plot the main lobe, we iteratively crop and add, respectively, 50 samples to the
original signal. We compare the pseudo-sinc function with maximizer obtained from
spectra achieved for signals with different time lengths.
A. A. Minda et al.
the made analysis, we can also see that the maximizer are distributed by a nonsymmetrical pseudo-sinc function with real frequency, justifying, at the same time,
the opportunity to use such functions in spectral analyzes.
2 Leakage Phenomena and the Frequency Estimation
of a Signal
It is considered a continuous harmonic signal with known angular frequency ω
and amplitude A. The discrete form of the continuous signal according to [9] is
{x} = {x[0], x[1], . . . , x[ j], . . . , x[N − 1]}. Each element of this sequence has a
real coefficient a j , an imaginary coefficient b j , and a modulus X j resulted from the
first two, which differ for different signal time lengths t S . After ignoring some terms
which are small if ω = 2π f is large enough, the modulus becomes:
X j =
sin[π ( f − j f )t s ]
π ( f − j f )t s
= sinc[π ( f − j f )t s ]
(1)
where f is the frequency resolution, f is the frequency of the generated signal,
and j is the spectral line number. If the term jf has values close to f the difference
f − j f → 0 and hence the sinc function is approaching the value 1 and the
maximizer X j approaches the real signal amplitude. If the value of jf departs
from f , the maximizer found with the sinc function gets a smaller value and a false
frequency and amplitude is found. The phenomenon is known as leakage.
3 The Developed Pseudo-sinc Function
Modifying the length of the analyzed signal t S , the maximizer for different signal
lengths will not be symmetric and spectral lines will no longer be equidistant. This is
highlighted in Fig. 1a, by plotting the sinc function with red line and the pseudo-sinc
function with blue line. Therefore, we propose using a non-symmetrical pseudo-sinc
function instead of the symetric sinc function.
In the studies presented herein, we considered signals generated with N S = 15,000
samples. For a certain value of f cor , we choose a number of cycles n and calculate:
the period T; the original signal length t S = T : n; and the frequency resolution f
= 1/t S . To represent the pseudo-sinc function, for example, for f cor = 8 Hz and for
n = 2 cycles, we calculate the period T = 0.125 s and the number of samples of
the original signal with length t S = 0.25 s, which is N S = 3750. Afterward, in order
to plot the main lobe, we iteratively crop and add, respectively, 50 samples to the
original signal. We compare the pseudo-sinc function with maximizer obtained from
spectra achieved for signals with different time lengths.