

33
1. Prepare solution A and solution B of the desired buffer, pH,
salt, etc. The two solutions are made identically except solid,
ultrapure urea (final concentration of 8 M) or GdnHCl
(final concentration of 6 M) is added to solution B prior to the
aliquots of stock buffer, salt, etc.
2. Add identical aliquots of concentrated protein to solution A
and solution B. The final protein concentration depends on
the instrumentation used to monitor unfolding, but typical
concentrations for fluorescence and circular dichroism (CD)
are 1–20 μM.
3. Prepare at least 25 samples consisting of evenly spaced mixtures (in denaturant concentration) of solution A and solution
B. For example, sample #1 is 100% solution A, sample #25 is
100% solution B, and samples #2–24 contain linearly increasing concentrations of denaturant. Use of a two-syringe
Hamilton dilutor or a manual repeating pipet is recommended
to minimize denaturant concentration error. Incubate samples
at the desired temperature until equilibrium is reached (typically ≥2 h).
4. Scan samples using the instrument of choice (UV/Vis spectrophotometer, fluorimeter, CD spectrophotometer) at the desired
wavelength. The observed signal (θ obs ) follows a sigmoidal
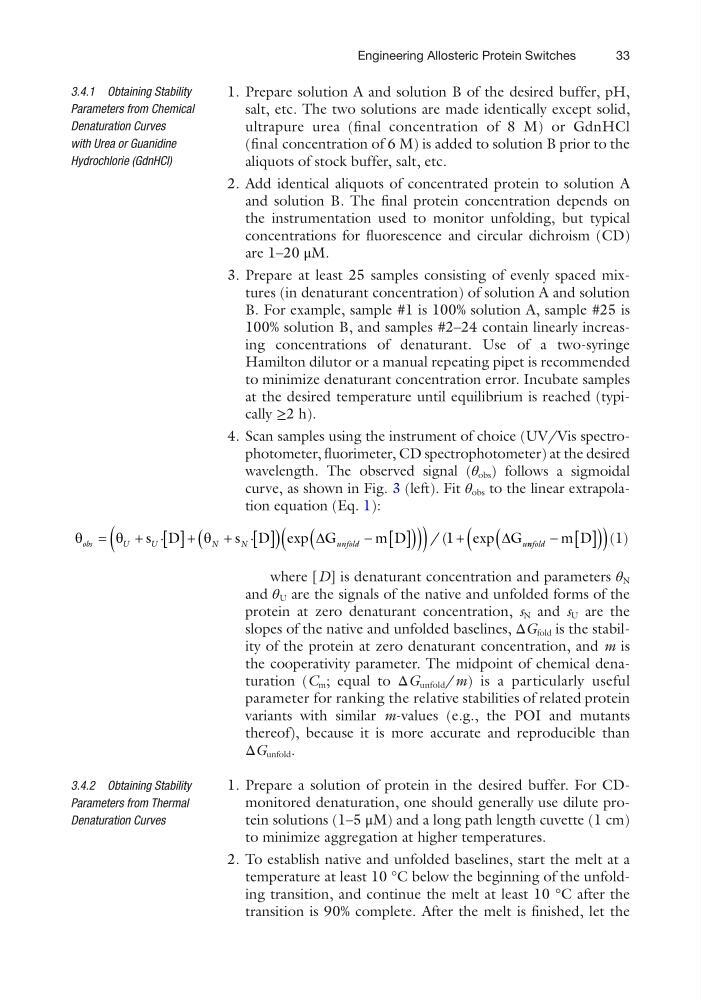
curve, as shown in Fig. 3 (left). Fit θ obs to the linear extrapolation equation (Eq. 1):
q
q
q
D
D
obs
U
U
N
N
unfold
u
=
+ [ ]+ + [ ]
(
)
- [ ]
(
)
(
)
(
) +
s D
s D
G
m D
G
·
·
exp
/ (
exp
1
n nfold - [ ]
(
)
(
)
m D (1)
where [D] is denaturant concentration and parameters θ N
and θ U are the signals of the native and unfolded forms of the
protein at zero denaturant concentration, s N and s U are the
slopes of the native and unfolded baselines, ΔG fold is the stability of the protein at zero denaturant concentration, and m is
the cooperativity parameter. The midpoint of chemical denaturation (C m ; equal to ΔG unfold /m) is a particularly useful
parameter for ranking the relative stabilities of related protein
variants with similar m-values (e.g., the POI and mutants
thereof), because it is more accurate and reproducible than
ΔG unfold .
1. Prepare a solution of protein in the desired buffer. For CDmonitored denaturation, one should generally use dilute protein solutions (1–5 μM) and a long path length cuvette (1 cm)
to minimize aggregation at higher temperatures.
2. To establish native and unfolded baselines, start the melt at a
temperature at least 10 °C below the beginning of the unfolding transition, and continue the melt at least 10 °C after the
transition is 90% complete. After the melt is finished, let the
3.4.1 Obtaining Stability
Parameters from Chemical
Denaturation Curves
with Urea or Guanidine
Hydrochlorie (GdnHCl)
3.4.2 Obtaining Stability
Parameters from Thermal
Denaturation Curves
Engineering Allosteric Protein Switches
1. Prepare solution A and solution B of the desired buffer, pH,
salt, etc. The two solutions are made identically except solid,
ultrapure urea (final concentration of 8 M) or GdnHCl
(final concentration of 6 M) is added to solution B prior to the
aliquots of stock buffer, salt, etc.
2. Add identical aliquots of concentrated protein to solution A
and solution B. The final protein concentration depends on
the instrumentation used to monitor unfolding, but typical
concentrations for fluorescence and circular dichroism (CD)
are 1–20 μM.
3. Prepare at least 25 samples consisting of evenly spaced mixtures (in denaturant concentration) of solution A and solution
B. For example, sample #1 is 100% solution A, sample #25 is
100% solution B, and samples #2–24 contain linearly increasing concentrations of denaturant. Use of a two-syringe
Hamilton dilutor or a manual repeating pipet is recommended
to minimize denaturant concentration error. Incubate samples
at the desired temperature until equilibrium is reached (typically ≥2 h).
4. Scan samples using the instrument of choice (UV/Vis spectrophotometer, fluorimeter, CD spectrophotometer) at the desired
wavelength. The observed signal (θ obs ) follows a sigmoidal
curve, as shown in Fig. 3 (left). Fit θ obs to the linear extrapolation equation (Eq. 1):
q
q
q
D
D
obs
U
U
N
N
unfold
u
=
+ [ ]+ + [ ]
(
)
- [ ]
(
)
(
)
(
) +
s D
s D
G
m D
G
·
·
exp
/ (
exp
1
n nfold - [ ]
(
)
(
)
m D (1)
where [D] is denaturant concentration and parameters θ N
and θ U are the signals of the native and unfolded forms of the
protein at zero denaturant concentration, s N and s U are the
slopes of the native and unfolded baselines, ΔG fold is the stability of the protein at zero denaturant concentration, and m is
the cooperativity parameter. The midpoint of chemical denaturation (C m ; equal to ΔG unfold /m) is a particularly useful
parameter for ranking the relative stabilities of related protein
variants with similar m-values (e.g., the POI and mutants
thereof), because it is more accurate and reproducible than
ΔG unfold .
1. Prepare a solution of protein in the desired buffer. For CDmonitored denaturation, one should generally use dilute protein solutions (1–5 μM) and a long path length cuvette (1 cm)
to minimize aggregation at higher temperatures.
2. To establish native and unfolded baselines, start the melt at a
temperature at least 10 °C below the beginning of the unfolding transition, and continue the melt at least 10 °C after the
transition is 90% complete. After the melt is finished, let the
3.4.1 Obtaining Stability
Parameters from Chemical
Denaturation Curves
with Urea or Guanidine
Hydrochlorie (GdnHCl)
3.4.2 Obtaining Stability
Parameters from Thermal
Denaturation Curves
Engineering Allosteric Protein Switches