

34
sample equilibrate at the starting temperature and record the
CD signal. Thermal denaturation is considered reversible if the
signal returns to ≥90% of its original value.
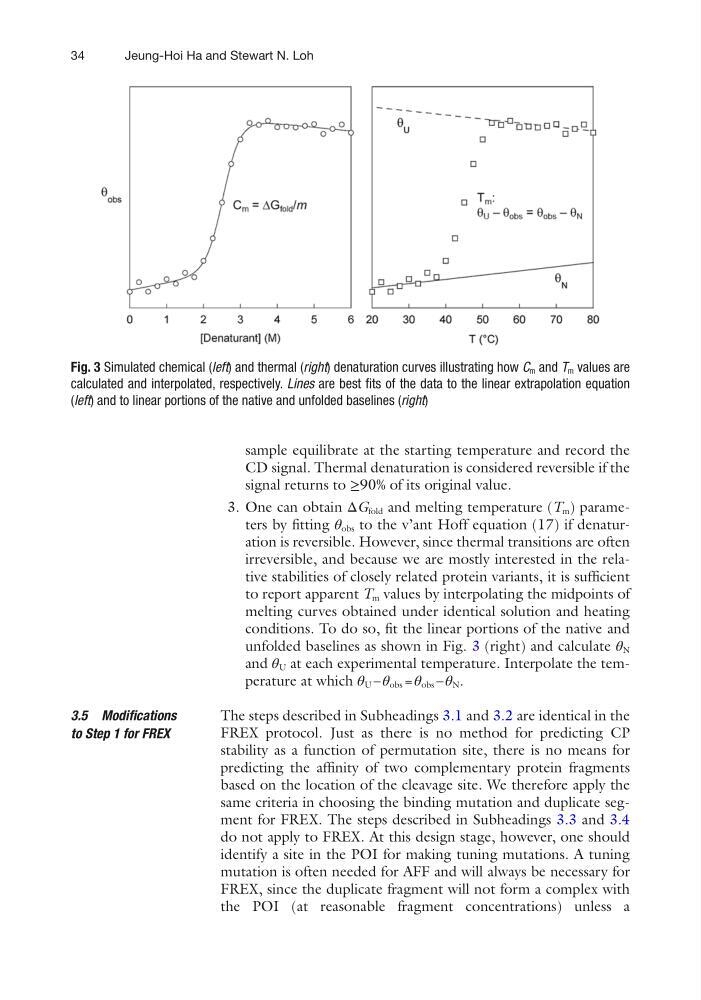
3. One can obtain ΔG fold and melting temperature (T m ) parameters by fitting θ obs to the v’ant Hoff equation (17) if denaturation is reversible. However, since thermal transitions are often
irreversible, and because we are mostly interested in the relative stabilities of closely related protein variants, it is sufficient
to report apparent T m values by interpolating the midpoints of
melting curves obtained under identical solution and heating
conditions. To do so, fit the linear portions of the native and
unfolded baselines as shown in Fig. 3 (right) and calculate θ N
and θ U at each experimental temperature. Interpolate the temperature at which θ U – θ obs = θ obs – θ N .
The steps described in Subheadings 3.1 and 3.2 are identical in the
FREX protocol. Just as there is no method for predicting CP
stability as a function of permutation site, there is no means for
predicting the affinity of two complementary protein fragments
based on the location of the cleavage site. We therefore apply the
same criteria in choosing the binding mutation and duplicate segment for FREX. The steps described in Subheadings 3.3 and 3.4
do not apply to FREX. At this design stage, however, one should
identify a site in the POI for making tuning mutations. A tuning
mutation is often needed for AFF and will always be necessary for
FREX, since the duplicate fragment will not form a complex with
the POI (at reasonable fragment concentrations) unless a
3.5 Modifications
to Step 1 for FREX
Fig. 3 Simulated chemical (left) and thermal (right) denaturation curves illustrating how C m and T m values are
calculated and interpolated, respectively. Lines are best fits of the data to the linear extrapolation equation
(left) and to linear portions of the native and unfolded baselines (right)
Jeung-Hoi Ha and Stewart N. Loh
sample equilibrate at the starting temperature and record the
CD signal. Thermal denaturation is considered reversible if the
signal returns to ≥90% of its original value.
3. One can obtain ΔG fold and melting temperature (T m ) parameters by fitting θ obs to the v’ant Hoff equation (17) if denaturation is reversible. However, since thermal transitions are often
irreversible, and because we are mostly interested in the relative stabilities of closely related protein variants, it is sufficient
to report apparent T m values by interpolating the midpoints of
melting curves obtained under identical solution and heating
conditions. To do so, fit the linear portions of the native and
unfolded baselines as shown in Fig. 3 (right) and calculate θ N
and θ U at each experimental temperature. Interpolate the temperature at which θ U – θ obs = θ obs – θ N .
The steps described in Subheadings 3.1 and 3.2 are identical in the
FREX protocol. Just as there is no method for predicting CP
stability as a function of permutation site, there is no means for
predicting the affinity of two complementary protein fragments
based on the location of the cleavage site. We therefore apply the
same criteria in choosing the binding mutation and duplicate segment for FREX. The steps described in Subheadings 3.3 and 3.4
do not apply to FREX. At this design stage, however, one should
identify a site in the POI for making tuning mutations. A tuning
mutation is often needed for AFF and will always be necessary for
FREX, since the duplicate fragment will not form a complex with
the POI (at reasonable fragment concentrations) unless a
3.5 Modifications
to Step 1 for FREX
Fig. 3 Simulated chemical (left) and thermal (right) denaturation curves illustrating how C m and T m values are
calculated and interpolated, respectively. Lines are best fits of the data to the linear extrapolation equation
(left) and to linear portions of the native and unfolded baselines (right)
Jeung-Hoi Ha and Stewart N. Loh