

84
3 A Structuring Regime to Control Bubbling Beds
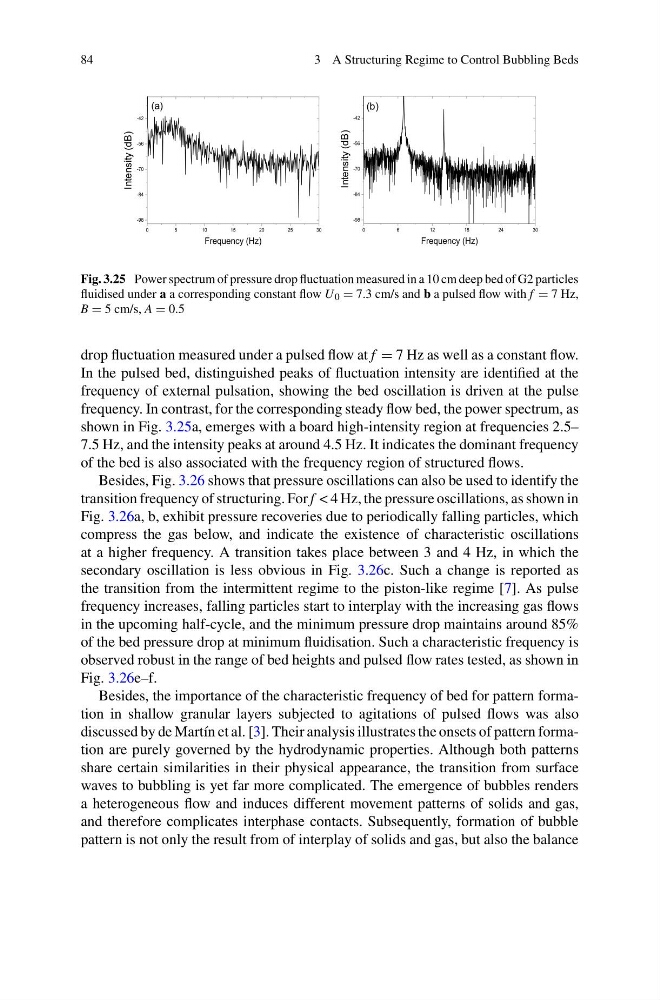
Fig. 3.25 Power spectrum of pressure drop fluctuation measured in a 10 cm deep bed of G2 particles
fluidised under a a corresponding constant flow U 0 = 7.3 cm/s and b a pulsed flow with f = 7 Hz,
B = 5 cm/s, A = 0.5
drop fluctuation measured under a pulsed flow at f = 7 Hz as well as a constant flow.
In the pulsed bed, distinguished peaks of fluctuation intensity are identified at the
frequency of external pulsation, showing the bed oscillation is driven at the pulse
frequency. In contrast, for the corresponding steady flow bed, the power spectrum, as
shown in Fig. 3.25a, emerges with a board high-intensity region at frequencies 2.5–
7.5 Hz, and the intensity peaks at around 4.5 Hz. It indicates the dominant frequency
of the bed is also associated with the frequency region of structured flows.
Besides, Fig. 3.26 shows that pressure oscillations can also be used to identify the
transition frequency of structuring. For f < 4 Hz, the pressure oscillations, as shown in
Fig. 3.26a, b, exhibit pressure recoveries due to periodically falling particles, which
compress the gas below, and indicate the existence of characteristic oscillations
at a higher frequency. A transition takes place between 3 and 4 Hz, in which the
secondary oscillation is less obvious in Fig. 3.26c. Such a change is reported as
the transition from the intermittent regime to the piston-like regime [7]. As pulse
frequency increases, falling particles start to interplay with the increasing gas flows
in the upcoming half-cycle, and the minimum pressure drop maintains around 85%
of the bed pressure drop at minimum fluidisation. Such a characteristic frequency is
observed robust in the range of bed heights and pulsed flow rates tested, as shown in
Fig. 3.26e–f.
Besides, the importance of the characteristic frequency of bed for pattern formation in shallow granular layers subjected to agitations of pulsed flows was also
discussed by de Martín et al. [3]. Their analysis illustrates the onsets of pattern formation are purely governed by the hydrodynamic properties. Although both patterns
share certain similarities in their physical appearance, the transition from surface
waves to bubbling is yet far more complicated. The emergence of bubbles renders
a heterogeneous flow and induces different movement patterns of solids and gas,
and therefore complicates interphase contacts. Subsequently, formation of bubble
pattern is not only the result from of interplay of solids and gas, but also the balance
3 A Structuring Regime to Control Bubbling Beds
Fig. 3.25 Power spectrum of pressure drop fluctuation measured in a 10 cm deep bed of G2 particles
fluidised under a a corresponding constant flow U 0 = 7.3 cm/s and b a pulsed flow with f = 7 Hz,
B = 5 cm/s, A = 0.5
drop fluctuation measured under a pulsed flow at f = 7 Hz as well as a constant flow.
In the pulsed bed, distinguished peaks of fluctuation intensity are identified at the
frequency of external pulsation, showing the bed oscillation is driven at the pulse
frequency. In contrast, for the corresponding steady flow bed, the power spectrum, as
shown in Fig. 3.25a, emerges with a board high-intensity region at frequencies 2.5–
7.5 Hz, and the intensity peaks at around 4.5 Hz. It indicates the dominant frequency
of the bed is also associated with the frequency region of structured flows.
Besides, Fig. 3.26 shows that pressure oscillations can also be used to identify the
transition frequency of structuring. For f < 4 Hz, the pressure oscillations, as shown in
Fig. 3.26a, b, exhibit pressure recoveries due to periodically falling particles, which
compress the gas below, and indicate the existence of characteristic oscillations
at a higher frequency. A transition takes place between 3 and 4 Hz, in which the
secondary oscillation is less obvious in Fig. 3.26c. Such a change is reported as
the transition from the intermittent regime to the piston-like regime [7]. As pulse
frequency increases, falling particles start to interplay with the increasing gas flows
in the upcoming half-cycle, and the minimum pressure drop maintains around 85%
of the bed pressure drop at minimum fluidisation. Such a characteristic frequency is
observed robust in the range of bed heights and pulsed flow rates tested, as shown in
Fig. 3.26e–f.
Besides, the importance of the characteristic frequency of bed for pattern formation in shallow granular layers subjected to agitations of pulsed flows was also
discussed by de Martín et al. [3]. Their analysis illustrates the onsets of pattern formation are purely governed by the hydrodynamic properties. Although both patterns
share certain similarities in their physical appearance, the transition from surface
waves to bubbling is yet far more complicated. The emergence of bubbles renders
a heterogeneous flow and induces different movement patterns of solids and gas,
and therefore complicates interphase contacts. Subsequently, formation of bubble
pattern is not only the result from of interplay of solids and gas, but also the balance