

3.3 Results and Discussion
85
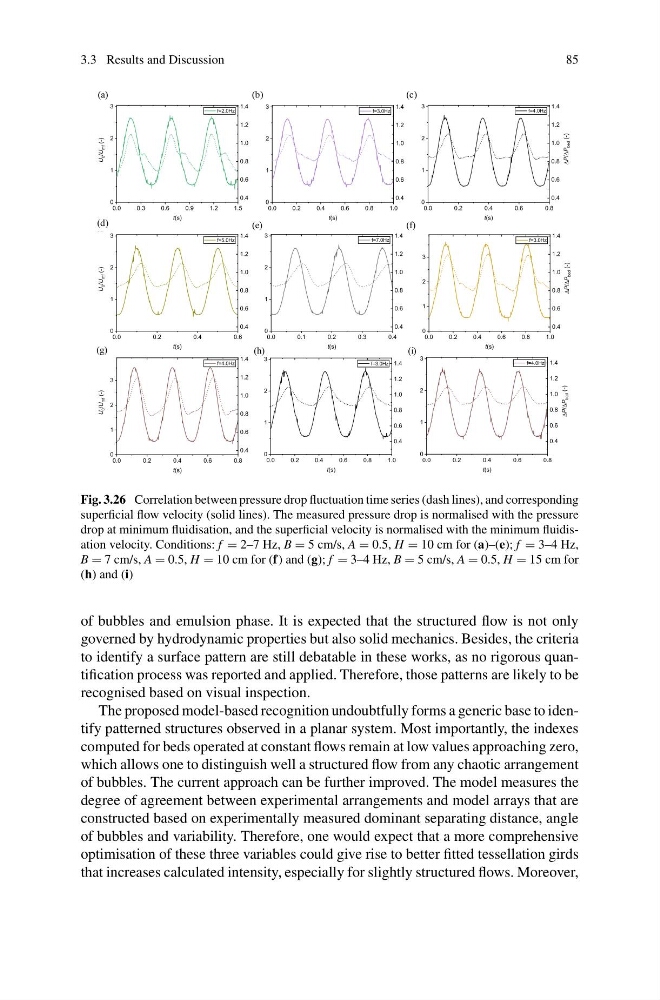
Fig. 3.26 Correlation between pressure drop fluctuation time series (dash lines), and corresponding
superficial flow velocity (solid lines). The measured pressure drop is normalised with the pressure
drop at minimum fluidisation, and the superficial velocity is normalised with the minimum fluidisation velocity. Conditions: f = 2–7 Hz, B = 5 cm/s, A = 0.5, H = 10 cm for (a)–(e); f = 3–4 Hz,
B = 7 cm/s, A = 0.5, H = 10 cm for (f) and (g); f = 3–4 Hz, B = 5 cm/s, A = 0.5, H = 15 cm for
(h) and (i)
of bubbles and emulsion phase. It is expected that the structured flow is not only
governed by hydrodynamic properties but also solid mechanics. Besides, the criteria
to identify a surface pattern are still debatable in these works, as no rigorous quantification process was reported and applied. Therefore, those patterns are likely to be
recognised based on visual inspection.
The proposed model-based recognition undoubtfully forms a generic base to identify patterned structures observed in a planar system. Most importantly, the indexes
computed for beds operated at constant flows remain at low values approaching zero,
which allows one to distinguish well a structured flow from any chaotic arrangement
of bubbles. The current approach can be further improved. The model measures the
degree of agreement between experimental arrangements and model arrays that are
constructed based on experimentally measured dominant separating distance, angle
of bubbles and variability. Therefore, one would expect that a more comprehensive
optimisation of these three variables could give rise to better fitted tessellation girds
that increases calculated intensity, especially for slightly structured flows. Moreover,
85
Fig. 3.26 Correlation between pressure drop fluctuation time series (dash lines), and corresponding
superficial flow velocity (solid lines). The measured pressure drop is normalised with the pressure
drop at minimum fluidisation, and the superficial velocity is normalised with the minimum fluidisation velocity. Conditions: f = 2–7 Hz, B = 5 cm/s, A = 0.5, H = 10 cm for (a)–(e); f = 3–4 Hz,
B = 7 cm/s, A = 0.5, H = 10 cm for (f) and (g); f = 3–4 Hz, B = 5 cm/s, A = 0.5, H = 15 cm for
(h) and (i)
of bubbles and emulsion phase. It is expected that the structured flow is not only
governed by hydrodynamic properties but also solid mechanics. Besides, the criteria
to identify a surface pattern are still debatable in these works, as no rigorous quantification process was reported and applied. Therefore, those patterns are likely to be
recognised based on visual inspection.
The proposed model-based recognition undoubtfully forms a generic base to identify patterned structures observed in a planar system. Most importantly, the indexes
computed for beds operated at constant flows remain at low values approaching zero,
which allows one to distinguish well a structured flow from any chaotic arrangement
of bubbles. The current approach can be further improved. The model measures the
degree of agreement between experimental arrangements and model arrays that are
constructed based on experimentally measured dominant separating distance, angle
of bubbles and variability. Therefore, one would expect that a more comprehensive
optimisation of these three variables could give rise to better fitted tessellation girds
that increases calculated intensity, especially for slightly structured flows. Moreover,