

3.3 Results and Discussion
79
depths. A weakly linear correlation is observed between the span of bubble size
distribution δ d and pattern intensity Λ. It shows that the span δ d monotonically
decreases with pattern intensity, meaning that bubbles become more uniform in size
with the degree of structuring. For a chaotic flow with Λ ~ 0, δ d is kept around 0.9.
In contrast, for a highly structured flow with Λ ≥ 0.4, the majority of measured δ d
is lower than 0.75. The lowest δ d reaches around 0.25 at Λ = 0.8.
As a result, structuring escalates in 16–72% increments to the homogeneity in
bubble size than that of a chaotic pulsed flow. Besides, uprising bubbles in the corresponding conventional fluidisation give rise to δ d ~ 1.0 alongside Λ ~ 0 (marked as
closed black circles), being qualitatively analogous to those in unstructured pulsed
flows. Overall, operating the system at a highly structured state provides an over 25%
improvement in terms of uniformity of bubble size.
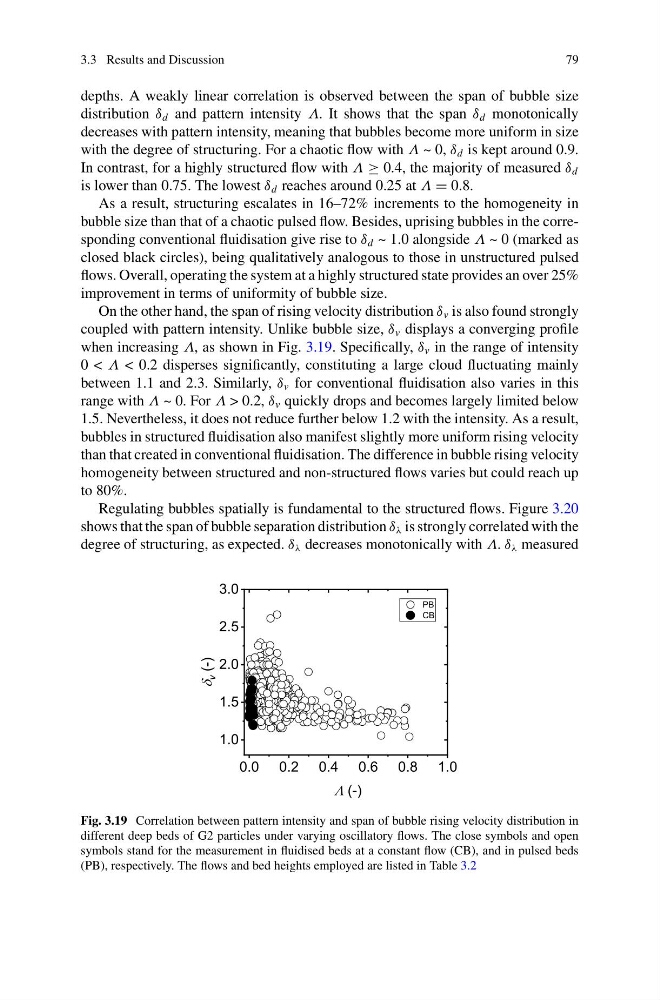
On the other hand, the span of rising velocity distribution δ v is also found strongly
coupled with pattern intensity. Unlike bubble size, δ v displays a converging profile
when increasing Λ, as shown in Fig. 3.19. Specifically, δ v in the range of intensity
0 < Λ < 0.2 disperses significantly, constituting a large cloud fluctuating mainly
between 1.1 and 2.3. Similarly, δ v for conventional fluidisation also varies in this
range with Λ ~ 0. For Λ > 0.2, δ v quickly drops and becomes largely limited below
1.5. Nevertheless, it does not reduce further below 1.2 with the intensity. As a result,
bubbles in structured fluidisation also manifest slightly more uniform rising velocity
than that created in conventional fluidisation. The difference in bubble rising velocity
homogeneity between structured and non-structured flows varies but could reach up
to 80%.
Regulating bubbles spatially is fundamental to the structured flows. Figure 3.20
shows that the span of bubble separation distribution δ λ is strongly correlated with the
degree of structuring, as expected. δ λ decreases monotonically with Λ. δ λ measured
Fig. 3.19 Correlation between pattern intensity and span of bubble rising velocity distribution in
different deep beds of G2 particles under varying oscillatory flows. The close symbols and open
symbols stand for the measurement in fluidised beds at a constant flow (CB), and in pulsed beds
(PB), respectively. The flows and bed heights employed are listed in Table 3.2
79
depths. A weakly linear correlation is observed between the span of bubble size
distribution δ d and pattern intensity Λ. It shows that the span δ d monotonically
decreases with pattern intensity, meaning that bubbles become more uniform in size
with the degree of structuring. For a chaotic flow with Λ ~ 0, δ d is kept around 0.9.
In contrast, for a highly structured flow with Λ ≥ 0.4, the majority of measured δ d
is lower than 0.75. The lowest δ d reaches around 0.25 at Λ = 0.8.
As a result, structuring escalates in 16–72% increments to the homogeneity in
bubble size than that of a chaotic pulsed flow. Besides, uprising bubbles in the corresponding conventional fluidisation give rise to δ d ~ 1.0 alongside Λ ~ 0 (marked as
closed black circles), being qualitatively analogous to those in unstructured pulsed
flows. Overall, operating the system at a highly structured state provides an over 25%
improvement in terms of uniformity of bubble size.
On the other hand, the span of rising velocity distribution δ v is also found strongly
coupled with pattern intensity. Unlike bubble size, δ v displays a converging profile
when increasing Λ, as shown in Fig. 3.19. Specifically, δ v in the range of intensity
0 < Λ < 0.2 disperses significantly, constituting a large cloud fluctuating mainly
between 1.1 and 2.3. Similarly, δ v for conventional fluidisation also varies in this
range with Λ ~ 0. For Λ > 0.2, δ v quickly drops and becomes largely limited below
1.5. Nevertheless, it does not reduce further below 1.2 with the intensity. As a result,
bubbles in structured fluidisation also manifest slightly more uniform rising velocity
than that created in conventional fluidisation. The difference in bubble rising velocity
homogeneity between structured and non-structured flows varies but could reach up
to 80%.
Regulating bubbles spatially is fundamental to the structured flows. Figure 3.20
shows that the span of bubble separation distribution δ λ is strongly correlated with the
degree of structuring, as expected. δ λ decreases monotonically with Λ. δ λ measured
Fig. 3.19 Correlation between pattern intensity and span of bubble rising velocity distribution in
different deep beds of G2 particles under varying oscillatory flows. The close symbols and open
symbols stand for the measurement in fluidised beds at a constant flow (CB), and in pulsed beds
(PB), respectively. The flows and bed heights employed are listed in Table 3.2