

3.3 Results and Discussion
77
5 0 %
75 %
10 0%
12
5%
3
4
5
6
7
8
9
1 0
5
7
9
11
F re qu en cy , f (H z)
Ampli tude, B (cm/s )
O
ff s e t, A
(- )
5 0 %
75 %
10 0%
12
5%
3
4
5
6
7
8
9
1 0
5
7
9
11
F re q u e n cy , f (H z)
Ampli
tude,
B
(cm/s
)
O
ff
s
e
t,
A
()
5 0 %
75 %
10 0%
12
5%
3
4
5
6
7
8
9
1 0
5
7
9
11
F re q u e n cy , f (H z)
Ampli
tude,
B
(cm/s
)
O
ff
s
e
t,
A
()
(b)
(a)
(d)
(c)
0.20
0.30
0.40
0.50
0.70
0.60
0.80
Pattern intensity Λ
5 0 %
75 %
10 0%
12
5%
3
4
5
6
7
8
9
1 0
5
7
9
11
F re q u e n cy , f (H z)
Ampli
tude,
B
(cm/s
)
O
ff
s
e
t,
A
()
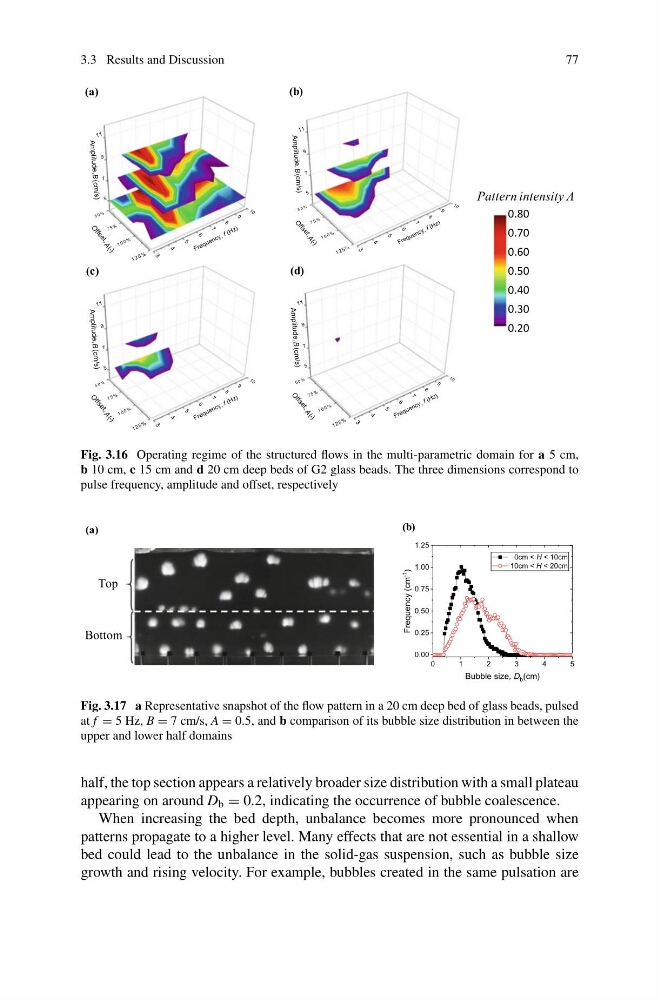
Fig. 3.16 Operating regime of the structured flows in the multi-parametric domain for a 5 cm,
b 10 cm, c 15 cm and d 20 cm deep beds of G2 glass beads. The three dimensions correspond to
pulse frequency, amplitude and offset, respectively
Bottom
Top
(b)
(a)
0
1
2
3
4
5
0.00
0.25
0.50
0.75
1.00
1.25
Frequency (cm
-1
)
Bubble size, D b (cm)
0cm < H < 10cm
10cm < H < 20cm
Fig. 3.17 a Representative snapshot of the flow pattern in a 20 cm deep bed of glass beads, pulsed
at f = 5 Hz, B = 7 cm/s, A = 0.5, and b comparison of its bubble size distribution in between the
upper and lower half domains
half, the top section appears a relatively broader size distribution with a small plateau
appearing on around D b = 0.2, indicating the occurrence of bubble coalescence.
When increasing the bed depth, unbalance becomes more pronounced when
patterns propagate to a higher level. Many effects that are not essential in a shallow
bed could lead to the unbalance in the solid-gas suspension, such as bubble size
growth and rising velocity. For example, bubbles created in the same pulsation are
77
5 0 %
75 %
10 0%
12
5%
3
4
5
6
7
8
9
1 0
5
7
9
11
F re qu en cy , f (H z)
Ampli tude, B (cm/s )
O
ff s e t, A
(- )
5 0 %
75 %
10 0%
12
5%
3
4
5
6
7
8
9
1 0
5
7
9
11
F re q u e n cy , f (H z)
Ampli
tude,
B
(cm/s
)
O
ff
s
e
t,
A
()
5 0 %
75 %
10 0%
12
5%
3
4
5
6
7
8
9
1 0
5
7
9
11
F re q u e n cy , f (H z)
Ampli
tude,
B
(cm/s
)
O
ff
s
e
t,
A
()
(b)
(a)
(d)
(c)
0.20
0.30
0.40
0.50
0.70
0.60
0.80
Pattern intensity Λ
5 0 %
75 %
10 0%
12
5%
3
4
5
6
7
8
9
1 0
5
7
9
11
F re q u e n cy , f (H z)
Ampli
tude,
B
(cm/s
)
O
ff
s
e
t,
A
()
Fig. 3.16 Operating regime of the structured flows in the multi-parametric domain for a 5 cm,
b 10 cm, c 15 cm and d 20 cm deep beds of G2 glass beads. The three dimensions correspond to
pulse frequency, amplitude and offset, respectively
Bottom
Top
(b)
(a)
0
1
2
3
4
5
0.00
0.25
0.50
0.75
1.00
1.25
Frequency (cm
-1
)
Bubble size, D b (cm)
0cm < H < 10cm
10cm < H < 20cm
Fig. 3.17 a Representative snapshot of the flow pattern in a 20 cm deep bed of glass beads, pulsed
at f = 5 Hz, B = 7 cm/s, A = 0.5, and b comparison of its bubble size distribution in between the
upper and lower half domains
half, the top section appears a relatively broader size distribution with a small plateau
appearing on around D b = 0.2, indicating the occurrence of bubble coalescence.
When increasing the bed depth, unbalance becomes more pronounced when
patterns propagate to a higher level. Many effects that are not essential in a shallow
bed could lead to the unbalance in the solid-gas suspension, such as bubble size
growth and rising velocity. For example, bubbles created in the same pulsation are