

3.3 Results and Discussion
73
Lateral distance (cm)
-40
-20
0
20
40
0
-2
2
0
-2
2
0
-2
2
0
-2
2
Axial distance (cm)
(a)
(b)
(c)
(d)
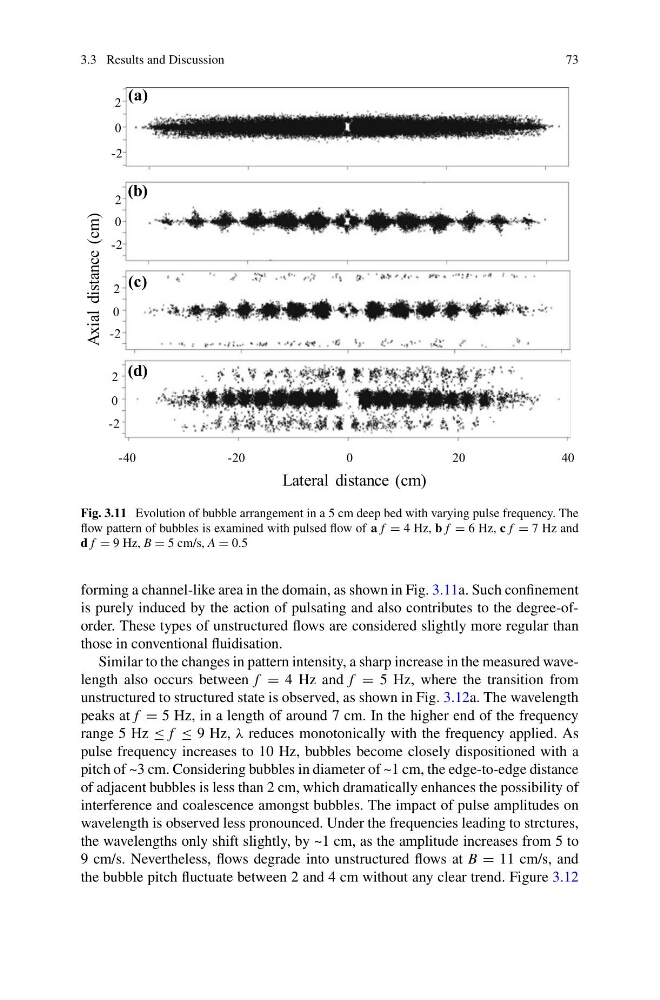
Fig. 3.11 Evolution of bubble arrangement in a 5 cm deep bed with varying pulse frequency. The
flow pattern of bubbles is examined with pulsed flow of a f = 4 Hz, b f = 6 Hz, c f = 7 Hz and
d f = 9 Hz, B = 5 cm/s, A = 0.5
forming a channel-like area in the domain, as shown in Fig. 3.11a. Such confinement
is purely induced by the action of pulsating and also contributes to the degree-oforder. These types of unstructured flows are considered slightly more regular than
those in conventional fluidisation.
Similar to the changes in pattern intensity, a sharp increase in the measured wavelength also occurs between f = 4 Hz and f = 5 Hz, where the transition from
unstructured to structured state is observed, as shown in Fig. 3.12a. The wavelength
peaks at f = 5 Hz, in a length of around 7 cm. In the higher end of the frequency
range 5 Hz ≤ f ≤ 9 Hz, λ reduces monotonically with the frequency applied. As
pulse frequency increases to 10 Hz, bubbles become closely dispositioned with a
pitch of ~3 cm. Considering bubbles in diameter of ~1 cm, the edge-to-edge distance
of adjacent bubbles is less than 2 cm, which dramatically enhances the possibility of
interference and coalescence amongst bubbles. The impact of pulse amplitudes on
wavelength is observed less pronounced. Under the frequencies leading to strctures,
the wavelengths only shift slightly, by ~1 cm, as the amplitude increases from 5 to
9 cm/s. Nevertheless, flows degrade into unstructured flows at B = 11 cm/s, and
the bubble pitch fluctuate between 2 and 4 cm without any clear trend. Figure 3.12
73
Lateral distance (cm)
-40
-20
0
20
40
0
-2
2
0
-2
2
0
-2
2
0
-2
2
Axial distance (cm)
(a)
(b)
(c)
(d)
Fig. 3.11 Evolution of bubble arrangement in a 5 cm deep bed with varying pulse frequency. The
flow pattern of bubbles is examined with pulsed flow of a f = 4 Hz, b f = 6 Hz, c f = 7 Hz and
d f = 9 Hz, B = 5 cm/s, A = 0.5
forming a channel-like area in the domain, as shown in Fig. 3.11a. Such confinement
is purely induced by the action of pulsating and also contributes to the degree-oforder. These types of unstructured flows are considered slightly more regular than
those in conventional fluidisation.
Similar to the changes in pattern intensity, a sharp increase in the measured wavelength also occurs between f = 4 Hz and f = 5 Hz, where the transition from
unstructured to structured state is observed, as shown in Fig. 3.12a. The wavelength
peaks at f = 5 Hz, in a length of around 7 cm. In the higher end of the frequency
range 5 Hz ≤ f ≤ 9 Hz, λ reduces monotonically with the frequency applied. As
pulse frequency increases to 10 Hz, bubbles become closely dispositioned with a
pitch of ~3 cm. Considering bubbles in diameter of ~1 cm, the edge-to-edge distance
of adjacent bubbles is less than 2 cm, which dramatically enhances the possibility of
interference and coalescence amongst bubbles. The impact of pulse amplitudes on
wavelength is observed less pronounced. Under the frequencies leading to strctures,
the wavelengths only shift slightly, by ~1 cm, as the amplitude increases from 5 to
9 cm/s. Nevertheless, flows degrade into unstructured flows at B = 11 cm/s, and
the bubble pitch fluctuate between 2 and 4 cm without any clear trend. Figure 3.12