

74
3 A Structuring Regime to Control Bubbling Beds
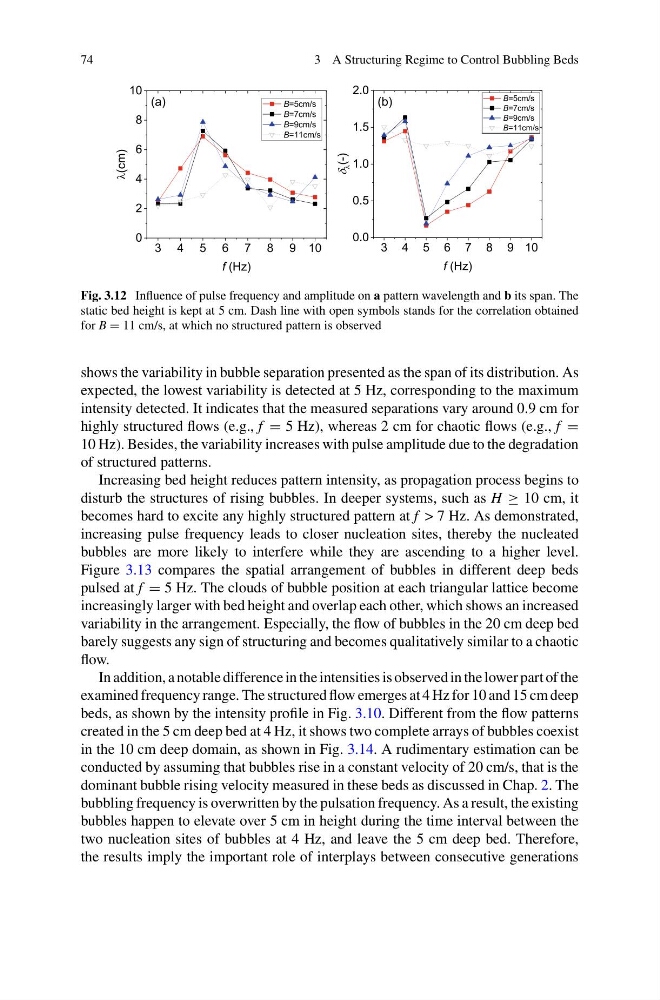
Fig. 3.12 Influence of pulse frequency and amplitude on a pattern wavelength and b its span. The
static bed height is kept at 5 cm. Dash line with open symbols stands for the correlation obtained
for B = 11 cm/s, at which no structured pattern is observed
shows the variability in bubble separation presented as the span of its distribution. As
expected, the lowest variability is detected at 5 Hz, corresponding to the maximum
intensity detected. It indicates that the measured separations vary around 0.9 cm for
highly structured flows (e.g., f = 5 Hz), whereas 2 cm for chaotic flows (e.g., f =
10 Hz). Besides, the variability increases with pulse amplitude due to the degradation
of structured patterns.
Increasing bed height reduces pattern intensity, as propagation process begins to
disturb the structures of rising bubbles. In deeper systems, such as H ≥ 10 cm, it
becomes hard to excite any highly structured pattern at f > 7 Hz. As demonstrated,
increasing pulse frequency leads to closer nucleation sites, thereby the nucleated
bubbles are more likely to interfere while they are ascending to a higher level.
Figure 3.13 compares the spatial arrangement of bubbles in different deep beds
pulsed at f = 5 Hz. The clouds of bubble position at each triangular lattice become
increasingly larger with bed height and overlap each other, which shows an increased
variability in the arrangement. Especially, the flow of bubbles in the 20 cm deep bed
barely suggests any sign of structuring and becomes qualitatively similar to a chaotic
flow.
In addition, a notable difference in the intensities is observed in the lower part of the
examined frequency range. The structured flow emerges at 4 Hz for 10 and 15 cm deep
beds, as shown by the intensity profile in Fig. 3.10. Different from the flow patterns
created in the 5 cm deep bed at 4 Hz, it shows two complete arrays of bubbles coexist
in the 10 cm deep domain, as shown in Fig. 3.14. A rudimentary estimation can be
conducted by assuming that bubbles rise in a constant velocity of 20 cm/s, that is the
dominant bubble rising velocity measured in these beds as discussed in Chap. 2. The
bubbling frequency is overwritten by the pulsation frequency. As a result, the existing
bubbles happen to elevate over 5 cm in height during the time interval between the
two nucleation sites of bubbles at 4 Hz, and leave the 5 cm deep bed. Therefore,
the results imply the important role of interplays between consecutive generations
3 A Structuring Regime to Control Bubbling Beds
Fig. 3.12 Influence of pulse frequency and amplitude on a pattern wavelength and b its span. The
static bed height is kept at 5 cm. Dash line with open symbols stands for the correlation obtained
for B = 11 cm/s, at which no structured pattern is observed
shows the variability in bubble separation presented as the span of its distribution. As
expected, the lowest variability is detected at 5 Hz, corresponding to the maximum
intensity detected. It indicates that the measured separations vary around 0.9 cm for
highly structured flows (e.g., f = 5 Hz), whereas 2 cm for chaotic flows (e.g., f =
10 Hz). Besides, the variability increases with pulse amplitude due to the degradation
of structured patterns.
Increasing bed height reduces pattern intensity, as propagation process begins to
disturb the structures of rising bubbles. In deeper systems, such as H ≥ 10 cm, it
becomes hard to excite any highly structured pattern at f > 7 Hz. As demonstrated,
increasing pulse frequency leads to closer nucleation sites, thereby the nucleated
bubbles are more likely to interfere while they are ascending to a higher level.
Figure 3.13 compares the spatial arrangement of bubbles in different deep beds
pulsed at f = 5 Hz. The clouds of bubble position at each triangular lattice become
increasingly larger with bed height and overlap each other, which shows an increased
variability in the arrangement. Especially, the flow of bubbles in the 20 cm deep bed
barely suggests any sign of structuring and becomes qualitatively similar to a chaotic
flow.
In addition, a notable difference in the intensities is observed in the lower part of the
examined frequency range. The structured flow emerges at 4 Hz for 10 and 15 cm deep
beds, as shown by the intensity profile in Fig. 3.10. Different from the flow patterns
created in the 5 cm deep bed at 4 Hz, it shows two complete arrays of bubbles coexist
in the 10 cm deep domain, as shown in Fig. 3.14. A rudimentary estimation can be
conducted by assuming that bubbles rise in a constant velocity of 20 cm/s, that is the
dominant bubble rising velocity measured in these beds as discussed in Chap. 2. The
bubbling frequency is overwritten by the pulsation frequency. As a result, the existing
bubbles happen to elevate over 5 cm in height during the time interval between the
two nucleation sites of bubbles at 4 Hz, and leave the 5 cm deep bed. Therefore,
the results imply the important role of interplays between consecutive generations