

3.2 Experimental Implementation and Analysis Methodology
67
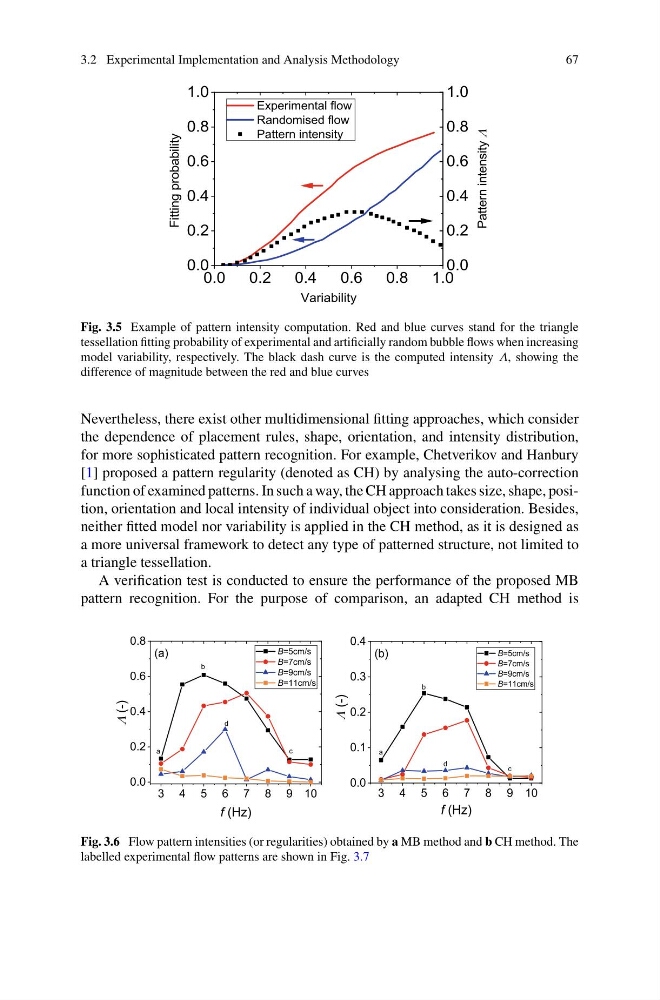
Fig. 3.5 Example of pattern intensity computation. Red and blue curves stand for the triangle
tessellation fitting probability of experimental and artificially random bubble flows when increasing
model variability, respectively. The black dash curve is the computed intensity Λ, showing the
difference of magnitude between the red and blue curves
Nevertheless, there exist other multidimensional fitting approaches, which consider
the dependence of placement rules, shape, orientation, and intensity distribution,
for more sophisticated pattern recognition. For example, Chetverikov and Hanbury
[1] proposed a pattern regularity (denoted as CH) by analysing the auto-correction
function of examined patterns. In such a way, the CH approach takes size, shape, position, orientation and local intensity of individual object into consideration. Besides,
neither fitted model nor variability is applied in the CH method, as it is designed as
a more universal framework to detect any type of patterned structure, not limited to
a triangle tessellation.
A verification test is conducted to ensure the performance of the proposed MB
pattern recognition. For the purpose of comparison, an adapted CH method is
Fig. 3.6 Flow pattern intensities (or regularities) obtained by a MB method and b CH method. The
labelled experimental flow patterns are shown in Fig. 3.7
67
Fig. 3.5 Example of pattern intensity computation. Red and blue curves stand for the triangle
tessellation fitting probability of experimental and artificially random bubble flows when increasing
model variability, respectively. The black dash curve is the computed intensity Λ, showing the
difference of magnitude between the red and blue curves
Nevertheless, there exist other multidimensional fitting approaches, which consider
the dependence of placement rules, shape, orientation, and intensity distribution,
for more sophisticated pattern recognition. For example, Chetverikov and Hanbury
[1] proposed a pattern regularity (denoted as CH) by analysing the auto-correction
function of examined patterns. In such a way, the CH approach takes size, shape, position, orientation and local intensity of individual object into consideration. Besides,
neither fitted model nor variability is applied in the CH method, as it is designed as
a more universal framework to detect any type of patterned structure, not limited to
a triangle tessellation.
A verification test is conducted to ensure the performance of the proposed MB
pattern recognition. For the purpose of comparison, an adapted CH method is
Fig. 3.6 Flow pattern intensities (or regularities) obtained by a MB method and b CH method. The
labelled experimental flow patterns are shown in Fig. 3.7