

68
3 A Structuring Regime to Control Bubbling Beds
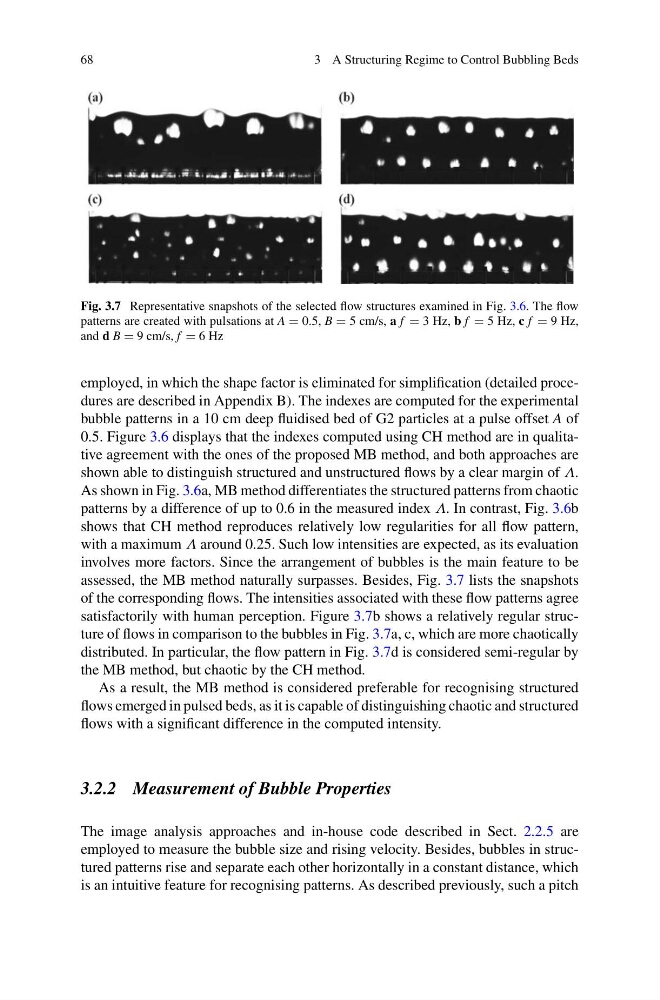
Fig. 3.7 Representative snapshots of the selected flow structures examined in Fig. 3.6. The flow
patterns are created with pulsations at A = 0.5, B = 5 cm/s, a f = 3 Hz, b f = 5 Hz, c f = 9 Hz,
and d B = 9 cm/s, f = 6 Hz
employed, in which the shape factor is eliminated for simplification (detailed procedures are described in Appendix B). The indexes are computed for the experimental
bubble patterns in a 10 cm deep fluidised bed of G2 particles at a pulse offset A of
0.5. Figure 3.6 displays that the indexes computed using CH method are in qualitative agreement with the ones of the proposed MB method, and both approaches are
shown able to distinguish structured and unstructured flows by a clear margin of Λ.
As shown in Fig. 3.6a, MB method differentiates the structured patterns from chaotic
patterns by a difference of up to 0.6 in the measured index Λ. In contrast, Fig. 3.6b
shows that CH method reproduces relatively low regularities for all flow pattern,
with a maximum Λ around 0.25. Such low intensities are expected, as its evaluation
involves more factors. Since the arrangement of bubbles is the main feature to be
assessed, the MB method naturally surpasses. Besides, Fig. 3.7 lists the snapshots
of the corresponding flows. The intensities associated with these flow patterns agree
satisfactorily with human perception. Figure 3.7b shows a relatively regular structure of flows in comparison to the bubbles in Fig. 3.7a, c, which are more chaotically
distributed. In particular, the flow pattern in Fig. 3.7d is considered semi-regular by
the MB method, but chaotic by the CH method.
As a result, the MB method is considered preferable for recognising structured
flows emerged in pulsed beds, as it is capable of distinguishing chaotic and structured
flows with a significant difference in the computed intensity.
3.2.2 Measurement of Bubble Properties
The image analysis approaches and in-house code described in Sect. 2.2.5 are
employed to measure the bubble size and rising velocity. Besides, bubbles in structured patterns rise and separate each other horizontally in a constant distance, which
is an intuitive feature for recognising patterns. As described previously, such a pitch
3 A Structuring Regime to Control Bubbling Beds
Fig. 3.7 Representative snapshots of the selected flow structures examined in Fig. 3.6. The flow
patterns are created with pulsations at A = 0.5, B = 5 cm/s, a f = 3 Hz, b f = 5 Hz, c f = 9 Hz,
and d B = 9 cm/s, f = 6 Hz
employed, in which the shape factor is eliminated for simplification (detailed procedures are described in Appendix B). The indexes are computed for the experimental
bubble patterns in a 10 cm deep fluidised bed of G2 particles at a pulse offset A of
0.5. Figure 3.6 displays that the indexes computed using CH method are in qualitative agreement with the ones of the proposed MB method, and both approaches are
shown able to distinguish structured and unstructured flows by a clear margin of Λ.
As shown in Fig. 3.6a, MB method differentiates the structured patterns from chaotic
patterns by a difference of up to 0.6 in the measured index Λ. In contrast, Fig. 3.6b
shows that CH method reproduces relatively low regularities for all flow pattern,
with a maximum Λ around 0.25. Such low intensities are expected, as its evaluation
involves more factors. Since the arrangement of bubbles is the main feature to be
assessed, the MB method naturally surpasses. Besides, Fig. 3.7 lists the snapshots
of the corresponding flows. The intensities associated with these flow patterns agree
satisfactorily with human perception. Figure 3.7b shows a relatively regular structure of flows in comparison to the bubbles in Fig. 3.7a, c, which are more chaotically
distributed. In particular, the flow pattern in Fig. 3.7d is considered semi-regular by
the MB method, but chaotic by the CH method.
As a result, the MB method is considered preferable for recognising structured
flows emerged in pulsed beds, as it is capable of distinguishing chaotic and structured
flows with a significant difference in the computed intensity.
3.2.2 Measurement of Bubble Properties
The image analysis approaches and in-house code described in Sect. 2.2.5 are
employed to measure the bubble size and rising velocity. Besides, bubbles in structured patterns rise and separate each other horizontally in a constant distance, which
is an intuitive feature for recognising patterns. As described previously, such a pitch