

2.3 Results and Discussion
55
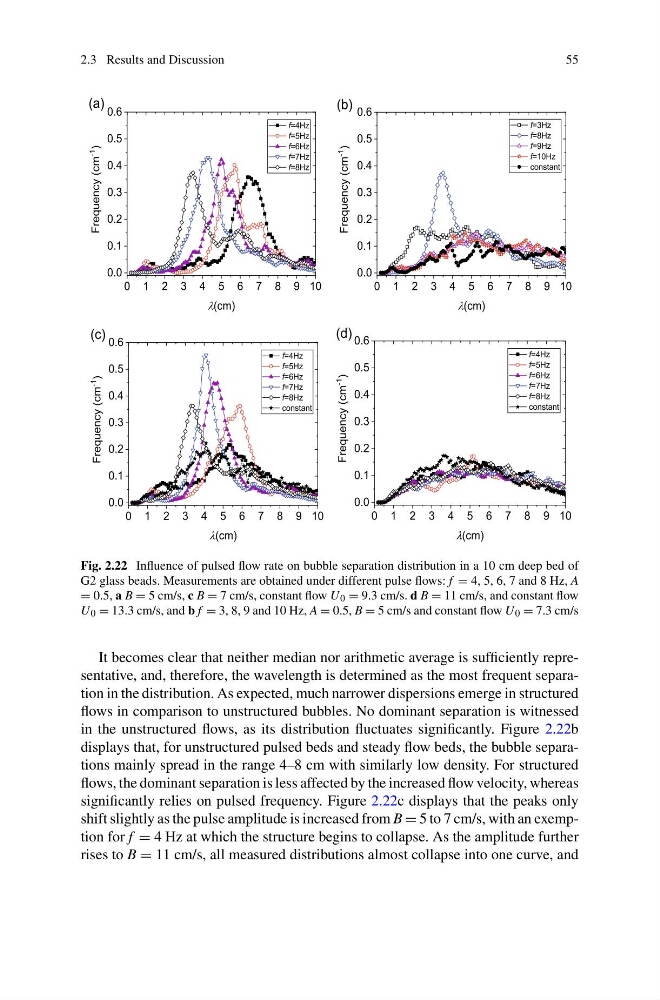
Fig. 2.22 Influence of pulsed flow rate on bubble separation distribution in a 10 cm deep bed of
G2 glass beads. Measurements are obtained under different pulse flows: f = 4, 5, 6, 7 and 8 Hz, A
= 0.5, a B = 5 cm/s, c B = 7 cm/s, constant flow U 0 = 9.3 cm/s. d B = 11 cm/s, and constant flow
U 0 = 13.3 cm/s, and b f = 3, 8, 9 and 10 Hz, A = 0.5, B = 5 cm/s and constant flow U 0 = 7.3 cm/s
It becomes clear that neither median nor arithmetic average is sufficiently representative, and, therefore, the wavelength is determined as the most frequent separation in the distribution. As expected, much narrower dispersions emerge in structured
flows in comparison to unstructured bubbles. No dominant separation is witnessed
in the unstructured flows, as its distribution fluctuates significantly. Figure 2.22b
displays that, for unstructured pulsed beds and steady flow beds, the bubble separations mainly spread in the range 4–8 cm with similarly low density. For structured
flows, the dominant separation is less affected by the increased flow velocity, whereas
significantly relies on pulsed frequency. Figure 2.22c displays that the peaks only
shift slightly as the pulse amplitude is increased from B = 5 to 7 cm/s, with an exemption for f = 4 Hz at which the structure begins to collapse. As the amplitude further
rises to B = 11 cm/s, all measured distributions almost collapse into one curve, and
55
Fig. 2.22 Influence of pulsed flow rate on bubble separation distribution in a 10 cm deep bed of
G2 glass beads. Measurements are obtained under different pulse flows: f = 4, 5, 6, 7 and 8 Hz, A
= 0.5, a B = 5 cm/s, c B = 7 cm/s, constant flow U 0 = 9.3 cm/s. d B = 11 cm/s, and constant flow
U 0 = 13.3 cm/s, and b f = 3, 8, 9 and 10 Hz, A = 0.5, B = 5 cm/s and constant flow U 0 = 7.3 cm/s
It becomes clear that neither median nor arithmetic average is sufficiently representative, and, therefore, the wavelength is determined as the most frequent separation in the distribution. As expected, much narrower dispersions emerge in structured
flows in comparison to unstructured bubbles. No dominant separation is witnessed
in the unstructured flows, as its distribution fluctuates significantly. Figure 2.22b
displays that, for unstructured pulsed beds and steady flow beds, the bubble separations mainly spread in the range 4–8 cm with similarly low density. For structured
flows, the dominant separation is less affected by the increased flow velocity, whereas
significantly relies on pulsed frequency. Figure 2.22c displays that the peaks only
shift slightly as the pulse amplitude is increased from B = 5 to 7 cm/s, with an exemption for f = 4 Hz at which the structure begins to collapse. As the amplitude further
rises to B = 11 cm/s, all measured distributions almost collapse into one curve, and