

54
2 Bubbling Properties in Pulsed Fluidised Beds
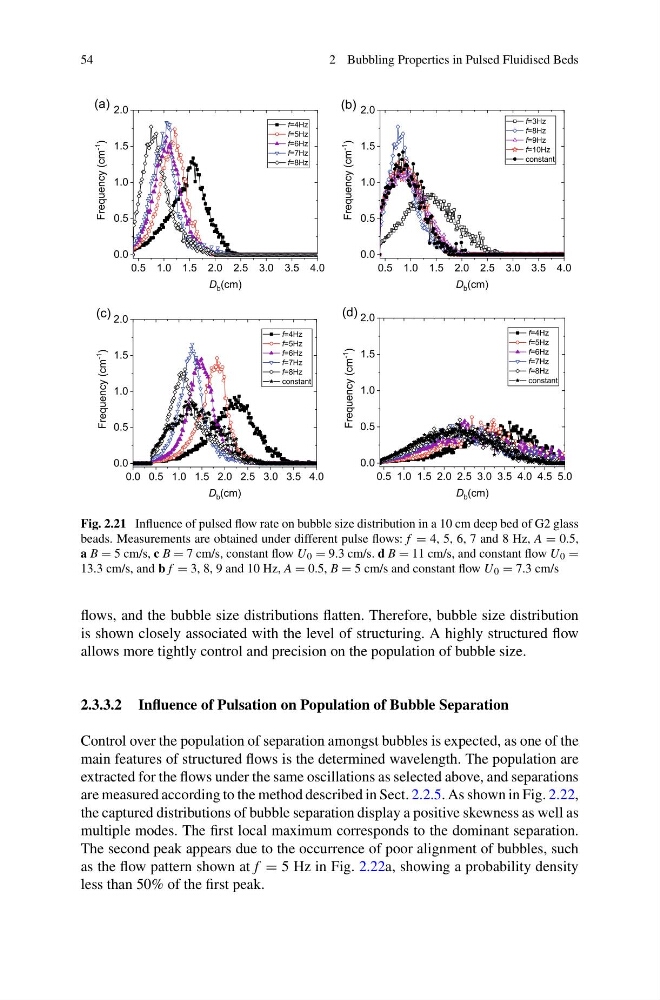
Fig. 2.21 Influence of pulsed flow rate on bubble size distribution in a 10 cm deep bed of G2 glass
beads. Measurements are obtained under different pulse flows: f = 4, 5, 6, 7 and 8 Hz, A = 0.5,
a B = 5 cm/s, c B = 7 cm/s, constant flow U 0 = 9.3 cm/s. d B = 11 cm/s, and constant flow U 0 =
13.3 cm/s, and b f = 3, 8, 9 and 10 Hz, A = 0.5, B = 5 cm/s and constant flow U 0 = 7.3 cm/s
flows, and the bubble size distributions flatten. Therefore, bubble size distribution
is shown closely associated with the level of structuring. A highly structured flow
allows more tightly control and precision on the population of bubble size.
2.3.3.2 Influence of Pulsation on Population of Bubble Separation
Control over the population of separation amongst bubbles is expected, as one of the
main features of structured flows is the determined wavelength. The population are
extracted for the flows under the same oscillations as selected above, and separations
are measured according to the method described in Sect. 2.2.5. As shown in Fig. 2.22,
the captured distributions of bubble separation display a positive skewness as well as
multiple modes. The first local maximum corresponds to the dominant separation.
The second peak appears due to the occurrence of poor alignment of bubbles, such
as the flow pattern shown at f = 5 Hz in Fig. 2.22a, showing a probability density
less than 50% of the first peak.
2 Bubbling Properties in Pulsed Fluidised Beds
Fig. 2.21 Influence of pulsed flow rate on bubble size distribution in a 10 cm deep bed of G2 glass
beads. Measurements are obtained under different pulse flows: f = 4, 5, 6, 7 and 8 Hz, A = 0.5,
a B = 5 cm/s, c B = 7 cm/s, constant flow U 0 = 9.3 cm/s. d B = 11 cm/s, and constant flow U 0 =
13.3 cm/s, and b f = 3, 8, 9 and 10 Hz, A = 0.5, B = 5 cm/s and constant flow U 0 = 7.3 cm/s
flows, and the bubble size distributions flatten. Therefore, bubble size distribution
is shown closely associated with the level of structuring. A highly structured flow
allows more tightly control and precision on the population of bubble size.
2.3.3.2 Influence of Pulsation on Population of Bubble Separation
Control over the population of separation amongst bubbles is expected, as one of the
main features of structured flows is the determined wavelength. The population are
extracted for the flows under the same oscillations as selected above, and separations
are measured according to the method described in Sect. 2.2.5. As shown in Fig. 2.22,
the captured distributions of bubble separation display a positive skewness as well as
multiple modes. The first local maximum corresponds to the dominant separation.
The second peak appears due to the occurrence of poor alignment of bubbles, such
as the flow pattern shown at f = 5 Hz in Fig. 2.22a, showing a probability density
less than 50% of the first peak.