

2.3 Results and Discussion
51
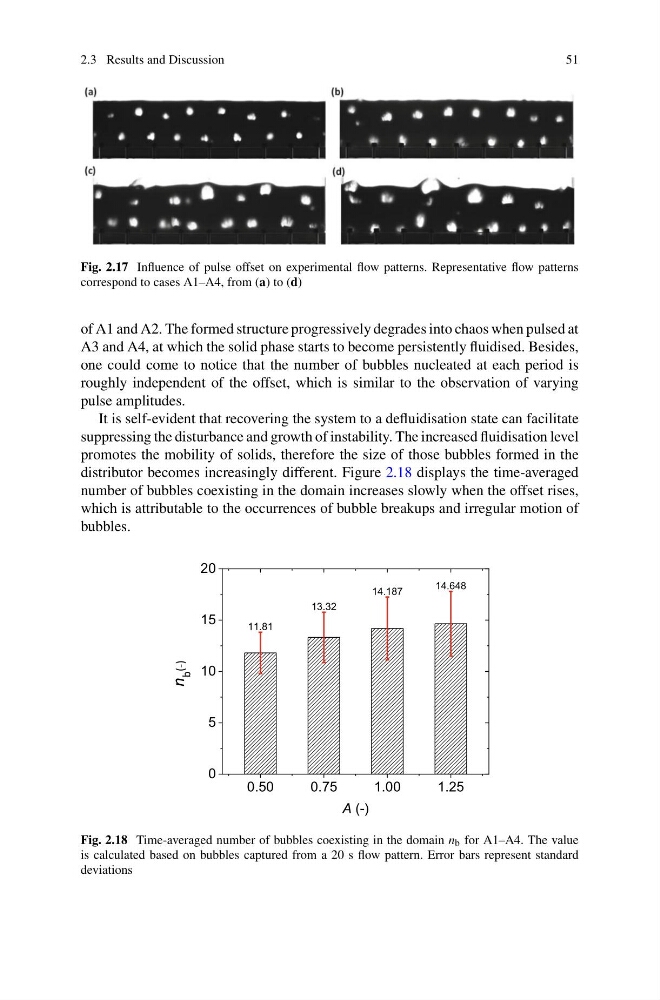
Fig. 2.17 Influence of pulse offset on experimental flow patterns. Representative flow patterns
correspond to cases A1–A4, from (a) to (d)
of A1 and A2. The formed structure progressively degrades into chaos when pulsed at
A3 and A4, at which the solid phase starts to become persistently fluidised. Besides,
one could come to notice that the number of bubbles nucleated at each period is
roughly independent of the offset, which is similar to the observation of varying
pulse amplitudes.
It is self-evident that recovering the system to a defluidisation state can facilitate
suppressing the disturbance and growth of instability. The increased fluidisation level
promotes the mobility of solids, therefore the size of those bubbles formed in the
distributor becomes increasingly different. Figure 2.18 displays the time-averaged
number of bubbles coexisting in the domain increases slowly when the offset rises,
which is attributable to the occurrences of bubble breakups and irregular motion of
bubbles.
0.50
0.75
1.00
1.25
0
5
10
15
20
11.81
13.32
14.187
14.648
A (-)
n
b
(-)
Fig. 2.18 Time-averaged number of bubbles coexisting in the domain n b for A1–A4. The value
is calculated based on bubbles captured from a 20 s flow pattern. Error bars represent standard
deviations
51
Fig. 2.17 Influence of pulse offset on experimental flow patterns. Representative flow patterns
correspond to cases A1–A4, from (a) to (d)
of A1 and A2. The formed structure progressively degrades into chaos when pulsed at
A3 and A4, at which the solid phase starts to become persistently fluidised. Besides,
one could come to notice that the number of bubbles nucleated at each period is
roughly independent of the offset, which is similar to the observation of varying
pulse amplitudes.
It is self-evident that recovering the system to a defluidisation state can facilitate
suppressing the disturbance and growth of instability. The increased fluidisation level
promotes the mobility of solids, therefore the size of those bubbles formed in the
distributor becomes increasingly different. Figure 2.18 displays the time-averaged
number of bubbles coexisting in the domain increases slowly when the offset rises,
which is attributable to the occurrences of bubble breakups and irregular motion of
bubbles.
0.50
0.75
1.00
1.25
0
5
10
15
20
11.81
13.32
14.187
14.648
A (-)
n
b
(-)
Fig. 2.18 Time-averaged number of bubbles coexisting in the domain n b for A1–A4. The value
is calculated based on bubbles captured from a 20 s flow pattern. Error bars represent standard
deviations