

2.3 Results and Discussion
49
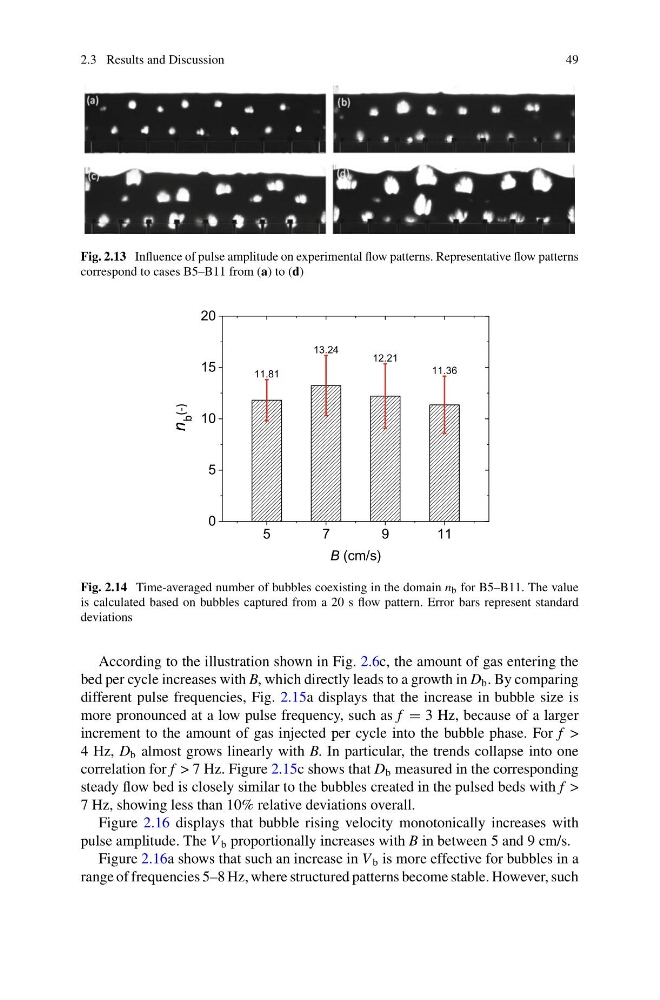
Fig. 2.13 Influence of pulse amplitude on experimental flow patterns. Representative flow patterns
correspond to cases B5–B11 from (a) to (d)
5
7
9
1 1
0
5
10
15
20
11.81
13.24
12.21
11.36
B (cm/s)
n
b
(-)
Fig. 2.14 Time-averaged number of bubbles coexisting in the domain n b for B5–B11. The value
is calculated based on bubbles captured from a 20 s flow pattern. Error bars represent standard
deviations
According to the illustration shown in Fig. 2.6c, the amount of gas entering the
bed per cycle increases with B, which directly leads to a growth in D b . By comparing
different pulse frequencies, Fig. 2.15a displays that the increase in bubble size is
more pronounced at a low pulse frequency, such as f = 3 Hz, because of a larger
increment to the amount of gas injected per cycle into the bubble phase. For f >
4 Hz, D b almost grows linearly with B. In particular, the trends collapse into one
correlation for f > 7 Hz. Figure 2.15c shows that D b measured in the corresponding
steady flow bed is closely similar to the bubbles created in the pulsed beds with f >
7 Hz, showing less than 10% relative deviations overall.
Figure 2.16 displays that bubble rising velocity monotonically increases with
pulse amplitude. The V b proportionally increases with B in between 5 and 9 cm/s.
Figure 2.16a shows that such an increase in V b is more effective for bubbles in a
range of frequencies 5–8 Hz, where structured patterns become stable. However, such
49
Fig. 2.13 Influence of pulse amplitude on experimental flow patterns. Representative flow patterns
correspond to cases B5–B11 from (a) to (d)
5
7
9
1 1
0
5
10
15
20
11.81
13.24
12.21
11.36
B (cm/s)
n
b
(-)
Fig. 2.14 Time-averaged number of bubbles coexisting in the domain n b for B5–B11. The value
is calculated based on bubbles captured from a 20 s flow pattern. Error bars represent standard
deviations
According to the illustration shown in Fig. 2.6c, the amount of gas entering the
bed per cycle increases with B, which directly leads to a growth in D b . By comparing
different pulse frequencies, Fig. 2.15a displays that the increase in bubble size is
more pronounced at a low pulse frequency, such as f = 3 Hz, because of a larger
increment to the amount of gas injected per cycle into the bubble phase. For f >
4 Hz, D b almost grows linearly with B. In particular, the trends collapse into one
correlation for f > 7 Hz. Figure 2.15c shows that D b measured in the corresponding
steady flow bed is closely similar to the bubbles created in the pulsed beds with f >
7 Hz, showing less than 10% relative deviations overall.
Figure 2.16 displays that bubble rising velocity monotonically increases with
pulse amplitude. The V b proportionally increases with B in between 5 and 9 cm/s.
Figure 2.16a shows that such an increase in V b is more effective for bubbles in a
range of frequencies 5–8 Hz, where structured patterns become stable. However, such